Search for Indicators
Active Living & Preventable Chronic Disease
This dashboard tracks select indicators related to healthy lifestyle, physical activity and preventable chronic disease throughout Community Memorial Foundation's 27 communities.
Indicator Gauge Icon Legend
Legend Colors
Red is bad, green is good, blue is not statistically different/neutral.
Compared to Distribution
 the value is in the best half of communities.
 the value is in the 2nd worst quarter of communities.
 the value is in the worst quarter of communities.
Compared to Target
 meets target;
  does not meet target.
Compared to a Single Value
 lower than the comparison value;
 higher than the comparison value;
 not statistically different from comparison value.
Trend

 non-significant change over time;
 significant change over time;
  no change over time.
Compared to Prior Value
 higher than the previous measurement period;
 lower than the previous measurement period;
 no statistically different change from previous measurement period.
Health / Other Conditions
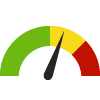
Adults with Kidney Disease Zip Code: Westchester (60154)
Adults with Kidney Disease Zip Code: Westchester (60154)
3.3%
(2021)
Compared to:

IL Zip Codes
The distribution is based on data from 1,378 Illinois zip codes.
U.S. Zip Codes
The distribution is based on data from 31,435 U.S. zip codes.
Cook, IL County Value
(3.1%)
The regional value is compared to the Cook County value.
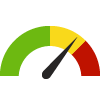
Adults with Kidney Disease Zip Code: Western Springs (60558)
Adults with Kidney Disease Zip Code: Western Springs (60558)
2.5%
(2021)
Compared to:
IL Zip Codes
The distribution is based on data from 1,378 Illinois zip codes.
U.S. Zip Codes
The distribution is based on data from 31,435 U.S. zip codes.
Cook, IL County Value
(3.1%)
The regional value is compared to the Cook County value.
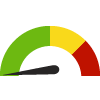
Adults with Kidney Disease Zip Code: Westmont (60559)
Adults with Kidney Disease Zip Code: Westmont (60559)
2.5%
(2021)
Compared to:
IL Zip Codes
The distribution is based on data from 1,378 Illinois zip codes.
U.S. Zip Codes
The distribution is based on data from 31,435 U.S. zip codes.
DuPage, IL County Value
(2.7%)
The regional value is compared to the DuPage County value.
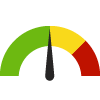
Adults with Kidney Disease Zip Code: Willow Springs (60480)
Adults with Kidney Disease Zip Code: Willow Springs (60480)
2.7%
(2021)
Compared to:

IL Zip Codes
The distribution is based on data from 1,378 Illinois zip codes.
U.S. Zip Codes
The distribution is based on data from 31,435 U.S. zip codes.
Cook, IL County Value
(3.1%)
The regional value is compared to the Cook County value.
Health / Physical Activity
Adults who are Sedentary Zip Code: Bridgeview (60455)
Adults who are Sedentary Zip Code: Bridgeview (60455)
28.1%
(2021)
Compared to:
IL Zip Codes
The distribution is based on data from 1,378 Illinois zip codes.
U.S. Zip Codes
The distribution is based on data from 31,435 U.S. zip codes.
Adults who are Sedentary Zip Code: Broadview (60155)
Adults who are Sedentary Zip Code: Broadview (60155)
29.4%
(2021)
Compared to:
IL Zip Codes
The distribution is based on data from 1,378 Illinois zip codes.
U.S. Zip Codes
The distribution is based on data from 31,435 U.S. zip codes.
Adults who are Sedentary Zip Code: Brookfield (60513)
Adults who are Sedentary Zip Code: Brookfield (60513)
21.0%
(2021)
Compared to:
IL Zip Codes
The distribution is based on data from 1,378 Illinois zip codes.
U.S. Zip Codes
The distribution is based on data from 31,435 U.S. zip codes.
Adults who are Sedentary Zip Code: Burr Ridge, Willowbrook (60527)
Adults who are Sedentary Zip Code: Burr Ridge, Willowbrook (60527)
21.7%
(2021)
Compared to:
IL Zip Codes
The distribution is based on data from 1,378 Illinois zip codes.
U.S. Zip Codes
The distribution is based on data from 31,435 U.S. zip codes.
Adults who are Sedentary Zip Code: Clarendon Hills (60514)
Adults who are Sedentary Zip Code: Clarendon Hills (60514)
19.0%
(2021)
Compared to:
IL Zip Codes
The distribution is based on data from 1,378 Illinois zip codes.
U.S. Zip Codes
The distribution is based on data from 31,435 U.S. zip codes.
Adults who are Sedentary Zip Code: Countryside, Hodgkins, Indian Head Park, La Grange, McCook (60525)
Adults who are Sedentary Zip Code: Countryside, Hodgkins, Indian Head Park, La Grange, McCook (60525)
20.4%
(2021)
Compared to:
IL Zip Codes
The distribution is based on data from 1,378 Illinois zip codes.
U.S. Zip Codes
The distribution is based on data from 31,435 U.S. zip codes.
Adults who are Sedentary Zip Code: Darien (60561)
Adults who are Sedentary Zip Code: Darien (60561)
21.9%
(2021)
Compared to:
IL Zip Codes
The distribution is based on data from 1,378 Illinois zip codes.
U.S. Zip Codes
The distribution is based on data from 31,435 U.S. zip codes.
Adults who are Sedentary Zip Code: Downers Grove (60515)
Adults who are Sedentary Zip Code: Downers Grove (60515)
19.8%
(2021)
Compared to:
IL Zip Codes
The distribution is based on data from 1,378 Illinois zip codes.
U.S. Zip Codes
The distribution is based on data from 31,435 U.S. zip codes.
Adults who are Sedentary Zip Code: Downers Grove (60516)
Adults who are Sedentary Zip Code: Downers Grove (60516)
20.7%
(2021)
Compared to:
IL Zip Codes
The distribution is based on data from 1,378 Illinois zip codes.
U.S. Zip Codes
The distribution is based on data from 31,435 U.S. zip codes.
Adults who are Sedentary Zip Code: Hickory Hills (60457)
Adults who are Sedentary Zip Code: Hickory Hills (60457)
27.4%
(2021)
Compared to:
IL Zip Codes
The distribution is based on data from 1,378 Illinois zip codes.
U.S. Zip Codes
The distribution is based on data from 31,435 U.S. zip codes.
Adults who are Sedentary Zip Code: Hinsdale (60521)
Adults who are Sedentary Zip Code: Hinsdale (60521)
16.7%
(2021)
Compared to:
IL Zip Codes
The distribution is based on data from 1,378 Illinois zip codes.
U.S. Zip Codes
The distribution is based on data from 31,435 U.S. zip codes.
Adults who are Sedentary Zip Code: Justice (60458)
Adults who are Sedentary Zip Code: Justice (60458)
29.4%
(2021)
Compared to:
IL Zip Codes
The distribution is based on data from 1,378 Illinois zip codes.
U.S. Zip Codes
The distribution is based on data from 31,435 U.S. zip codes.
Adults who are Sedentary Zip Code: Lyons (60534)
Adults who are Sedentary Zip Code: Lyons (60534)
29.1%
(2021)
Compared to:
IL Zip Codes
The distribution is based on data from 1,378 Illinois zip codes.
U.S. Zip Codes
The distribution is based on data from 31,435 U.S. zip codes.
Adults who are Sedentary Zip Code: North Riverside, Riverside (60546)
Adults who are Sedentary Zip Code: North Riverside, Riverside (60546)
21.2%
(2021)
Compared to:
IL Zip Codes
The distribution is based on data from 1,378 Illinois zip codes.
U.S. Zip Codes
The distribution is based on data from 31,435 U.S. zip codes.
Adults who are Sedentary Zip Code: Oak Brook (60523)
Adults who are Sedentary Zip Code: Oak Brook (60523)
24.3%
(2021)
Compared to:
IL Zip Codes
The distribution is based on data from 1,378 Illinois zip codes.
U.S. Zip Codes
The distribution is based on data from 31,435 U.S. zip codes.
Adults who are Sedentary Zip Code: Stickney (60402)
Adults who are Sedentary Zip Code: Stickney (60402)
29.7%
(2021)
Compared to:
IL Zip Codes
The distribution is based on data from 1,378 Illinois zip codes.
U.S. Zip Codes
The distribution is based on data from 31,435 U.S. zip codes.
Adults who are Sedentary Zip Code: Summit (60501)
Adults who are Sedentary Zip Code: Summit (60501)
36.7%
(2021)
Compared to:

IL Zip Codes
The distribution is based on data from 1,378 Illinois zip codes.
U.S. Zip Codes
The distribution is based on data from 31,435 U.S. zip codes.
Adults who are Sedentary Zip Code: Westchester (60154)
Adults who are Sedentary Zip Code: Westchester (60154)
23.4%
(2021)
Compared to:
IL Zip Codes
The distribution is based on data from 1,378 Illinois zip codes.
U.S. Zip Codes
The distribution is based on data from 31,435 U.S. zip codes.
Adults who are Sedentary Zip Code: Western Springs (60558)
Adults who are Sedentary Zip Code: Western Springs (60558)
15.8%
(2021)
Compared to:
IL Zip Codes
The distribution is based on data from 1,378 Illinois zip codes.
U.S. Zip Codes
The distribution is based on data from 31,435 U.S. zip codes.
Adults who are Sedentary Zip Code: Westmont (60559)
Adults who are Sedentary Zip Code: Westmont (60559)
22.5%
(2021)
Compared to:
IL Zip Codes
The distribution is based on data from 1,378 Illinois zip codes.
U.S. Zip Codes
The distribution is based on data from 31,435 U.S. zip codes.
Adults who are Sedentary Zip Code: Willow Springs (60480)
Adults who are Sedentary Zip Code: Willow Springs (60480)
22.2%
(2021)
Compared to:
IL Zip Codes
The distribution is based on data from 1,378 Illinois zip codes.
U.S. Zip Codes
The distribution is based on data from 31,435 U.S. zip codes.
Health / Weight Status
Adults Who Are Obese Zip Code: Bridgeview (60455)
Adults Who Are Obese Zip Code: Bridgeview (60455)
31.2%
(2021)
Compared to:
IL Zip Codes
The distribution is based on data from 1,378 Illinois zip codes.
U.S. Zip Codes
The distribution is based on data from 31,435 U.S. zip codes.
Adults Who Are Obese Zip Code: Broadview (60155)
Adults Who Are Obese Zip Code: Broadview (60155)
37.7%
(2021)
Compared to:
IL Zip Codes
The distribution is based on data from 1,378 Illinois zip codes.
U.S. Zip Codes
The distribution is based on data from 31,435 U.S. zip codes.
Adults Who Are Obese Zip Code: Brookfield (60513)
Adults Who Are Obese Zip Code: Brookfield (60513)
28.3%
(2021)
Compared to:
IL Zip Codes
The distribution is based on data from 1,378 Illinois zip codes.
U.S. Zip Codes
The distribution is based on data from 31,435 U.S. zip codes.
Adults Who Are Obese Zip Code: Burr Ridge, Willowbrook (60527)
Adults Who Are Obese Zip Code: Burr Ridge, Willowbrook (60527)
29.8%
(2021)
Compared to:
IL Zip Codes
The distribution is based on data from 1,378 Illinois zip codes.
U.S. Zip Codes
The distribution is based on data from 31,435 U.S. zip codes.
DuPage, IL County Value
(25.3% in 2018)
The regional value is compared to the DuPage County value.
Adults Who Are Obese Zip Code: Clarendon Hills (60514)
Adults Who Are Obese Zip Code: Clarendon Hills (60514)
30.6%
(2021)
Compared to:
IL Zip Codes
The distribution is based on data from 1,378 Illinois zip codes.
U.S. Zip Codes
The distribution is based on data from 31,435 U.S. zip codes.
DuPage, IL County Value
(25.3% in 2018)
The regional value is compared to the DuPage County value.
Adults Who Are Obese Zip Code: Countryside, Hodgkins, Indian Head Park, La Grange, McCook (60525)
Adults Who Are Obese Zip Code: Countryside, Hodgkins, Indian Head Park, La Grange, McCook (60525)
27.5%
(2021)
Compared to:
IL Zip Codes
The distribution is based on data from 1,378 Illinois zip codes.
U.S. Zip Codes
The distribution is based on data from 31,435 U.S. zip codes.
Adults Who Are Obese Zip Code: Darien (60561)
Adults Who Are Obese Zip Code: Darien (60561)
30.5%
(2021)
Compared to:
IL Zip Codes
The distribution is based on data from 1,378 Illinois zip codes.
U.S. Zip Codes
The distribution is based on data from 31,435 U.S. zip codes.
DuPage, IL County Value
(25.3% in 2018)
The regional value is compared to the DuPage County value.
Adults Who Are Obese Zip Code: Downers Grove (60515)
Adults Who Are Obese Zip Code: Downers Grove (60515)
30.5%
(2021)
Compared to:
IL Zip Codes
The distribution is based on data from 1,378 Illinois zip codes.
U.S. Zip Codes
The distribution is based on data from 31,435 U.S. zip codes.
DuPage, IL County Value
(25.3% in 2018)
The regional value is compared to the DuPage County value.
Adults Who Are Obese Zip Code: Downers Grove (60516)
Adults Who Are Obese Zip Code: Downers Grove (60516)
30.8%
(2021)
Compared to:
IL Zip Codes
The distribution is based on data from 1,378 Illinois zip codes.
U.S. Zip Codes
The distribution is based on data from 31,435 U.S. zip codes.
DuPage, IL County Value
(25.3% in 2018)
The regional value is compared to the DuPage County value.
Adults Who Are Obese Zip Code: Hickory Hills (60457)
Adults Who Are Obese Zip Code: Hickory Hills (60457)
31.3%
(2021)
Compared to:
IL Zip Codes
The distribution is based on data from 1,378 Illinois zip codes.
U.S. Zip Codes
The distribution is based on data from 31,435 U.S. zip codes.
Adults Who Are Obese Zip Code: Hinsdale (60521)
Adults Who Are Obese Zip Code: Hinsdale (60521)
28.4%
(2021)
Compared to:
IL Zip Codes
The distribution is based on data from 1,378 Illinois zip codes.
U.S. Zip Codes
The distribution is based on data from 31,435 U.S. zip codes.
DuPage, IL County Value
(25.3% in 2018)
The regional value is compared to the DuPage County value.
Adults Who Are Obese Zip Code: Justice (60458)
Adults Who Are Obese Zip Code: Justice (60458)
33.8%
(2021)
Compared to:
IL Zip Codes
The distribution is based on data from 1,378 Illinois zip codes.
U.S. Zip Codes
The distribution is based on data from 31,435 U.S. zip codes.
Adults Who Are Obese Zip Code: La Grange Park (60526)
Adults Who Are Obese Zip Code: La Grange Park (60526)
25.3%
(2021)
Compared to:
IL Zip Codes
The distribution is based on data from 1,378 Illinois zip codes.
U.S. Zip Codes
The distribution is based on data from 31,435 U.S. zip codes.
Adults Who Are Obese Zip Code: Lyons (60534)
Adults Who Are Obese Zip Code: Lyons (60534)
32.4%
(2021)
Compared to:
IL Zip Codes
The distribution is based on data from 1,378 Illinois zip codes.
U.S. Zip Codes
The distribution is based on data from 31,435 U.S. zip codes.
Adults Who Are Obese Zip Code: North Riverside, Riverside (60546)
Adults Who Are Obese Zip Code: North Riverside, Riverside (60546)
27.9%
(2021)
Compared to:
IL Zip Codes
The distribution is based on data from 1,378 Illinois zip codes.
U.S. Zip Codes
The distribution is based on data from 31,435 U.S. zip codes.
Adults Who Are Obese Zip Code: Oak Brook (60523)
Adults Who Are Obese Zip Code: Oak Brook (60523)
27.4%
(2021)
Compared to:
IL Zip Codes
The distribution is based on data from 1,378 Illinois zip codes.
U.S. Zip Codes
The distribution is based on data from 31,435 U.S. zip codes.
DuPage, IL County Value
(25.3% in 2018)
The regional value is compared to the DuPage County value.
Adults Who Are Obese Zip Code: Stickney (60402)
Adults Who Are Obese Zip Code: Stickney (60402)
32.6%
(2021)
Compared to:
IL Zip Codes
The distribution is based on data from 1,378 Illinois zip codes.
U.S. Zip Codes
The distribution is based on data from 31,435 U.S. zip codes.
Adults Who Are Obese Zip Code: Summit (60501)
Adults Who Are Obese Zip Code: Summit (60501)
36.2%
(2021)
Compared to:
IL Zip Codes
The distribution is based on data from 1,378 Illinois zip codes.
U.S. Zip Codes
The distribution is based on data from 31,435 U.S. zip codes.
Adults Who Are Obese Zip Code: Westchester (60154)
Adults Who Are Obese Zip Code: Westchester (60154)
28.5%
(2021)
Compared to:
IL Zip Codes
The distribution is based on data from 1,378 Illinois zip codes.
U.S. Zip Codes
The distribution is based on data from 31,435 U.S. zip codes.
Adults Who Are Obese Zip Code: Western Springs (60558)
Adults Who Are Obese Zip Code: Western Springs (60558)
25.5%
(2021)
Compared to:
IL Zip Codes
The distribution is based on data from 1,378 Illinois zip codes.
U.S. Zip Codes
The distribution is based on data from 31,435 U.S. zip codes.
Adults Who Are Obese Zip Code: Westmont (60559)
Adults Who Are Obese Zip Code: Westmont (60559)
31.0%
(2021)
Compared to:
IL Zip Codes
The distribution is based on data from 1,378 Illinois zip codes.
U.S. Zip Codes
The distribution is based on data from 31,435 U.S. zip codes.
DuPage, IL County Value
(25.3% in 2018)
The regional value is compared to the DuPage County value.
Adults Who Are Obese Zip Code: Willow Springs (60480)
Adults Who Are Obese Zip Code: Willow Springs (60480)
28.9%
(2021)
Compared to:
IL Zip Codes
The distribution is based on data from 1,378 Illinois zip codes.
U.S. Zip Codes
The distribution is based on data from 31,435 U.S. zip codes.
Health / Wellness & Lifestyle
Poor Physical Health: 14+ Days Zip Code: Bridgeview (60455)
Poor Physical Health: 14+ Days Zip Code: Bridgeview (60455)
12.0%
(2021)
Compared to:
IL Zip Codes
The distribution is based on data from 1,378 Illinois zip codes.
U.S. Zip Codes
The distribution is based on data from 31,435 U.S. zip codes.
Cook, IL County Value
(10.5%)
The regional value is compared to the Cook County value.
Poor Physical Health: 14+ Days Zip Code: Broadview (60155)
Poor Physical Health: 14+ Days Zip Code: Broadview (60155)
11.3%
(2021)
Compared to:
IL Zip Codes
The distribution is based on data from 1,378 Illinois zip codes.
U.S. Zip Codes
The distribution is based on data from 31,435 U.S. zip codes.
Cook, IL County Value
(10.5%)
The regional value is compared to the Cook County value.
Poor Physical Health: 14+ Days Zip Code: Burr Ridge, Willowbrook (60527)
Poor Physical Health: 14+ Days Zip Code: Burr Ridge, Willowbrook (60527)
8.8%
(2021)
Compared to:
IL Zip Codes
The distribution is based on data from 1,378 Illinois zip codes.
U.S. Zip Codes
The distribution is based on data from 31,435 U.S. zip codes.
DuPage, IL County Value
(8.8%)
The regional value is compared to the DuPage County value.
Poor Physical Health: 14+ Days Zip Code: Clarendon Hills (60514)
Poor Physical Health: 14+ Days Zip Code: Clarendon Hills (60514)
8.1%
(2021)
Compared to:
IL Zip Codes
The distribution is based on data from 1,378 Illinois zip codes.
U.S. Zip Codes
The distribution is based on data from 31,435 U.S. zip codes.
DuPage, IL County Value
(8.8%)
The regional value is compared to the DuPage County value.
Poor Physical Health: 14+ Days Zip Code: Countryside, Hodgkins, Indian Head Park, La Grange, McCook (60525)
Poor Physical Health: 14+ Days Zip Code: Countryside, Hodgkins, Indian Head Park, La Grange, McCook (60525)
9.2%
(2021)
Compared to:
IL Zip Codes
The distribution is based on data from 1,378 Illinois zip codes.
U.S. Zip Codes
The distribution is based on data from 31,435 U.S. zip codes.
Cook, IL County Value
(10.5%)
The regional value is compared to the Cook County value.
Poor Physical Health: 14+ Days Zip Code: Darien (60561)
Poor Physical Health: 14+ Days Zip Code: Darien (60561)
9.0%
(2021)
Compared to:
IL Zip Codes
The distribution is based on data from 1,378 Illinois zip codes.
U.S. Zip Codes
The distribution is based on data from 31,435 U.S. zip codes.
DuPage, IL County Value
(8.8%)
The regional value is compared to the DuPage County value.
Poor Physical Health: 14+ Days Zip Code: Downers Grove (60515)
Poor Physical Health: 14+ Days Zip Code: Downers Grove (60515)
8.5%
(2021)
Compared to:
IL Zip Codes
The distribution is based on data from 1,378 Illinois zip codes.
U.S. Zip Codes
The distribution is based on data from 31,435 U.S. zip codes.
DuPage, IL County Value
(8.8%)
The regional value is compared to the DuPage County value.
Poor Physical Health: 14+ Days Zip Code: Downers Grove (60516)
Poor Physical Health: 14+ Days Zip Code: Downers Grove (60516)
8.7%
(2021)
Compared to:
IL Zip Codes
The distribution is based on data from 1,378 Illinois zip codes.
U.S. Zip Codes
The distribution is based on data from 31,435 U.S. zip codes.
DuPage, IL County Value
(8.8%)
The regional value is compared to the DuPage County value.
Poor Physical Health: 14+ Days Zip Code: Hickory Hills (60457)
Poor Physical Health: 14+ Days Zip Code: Hickory Hills (60457)
11.9%
(2021)
Compared to:
IL Zip Codes
The distribution is based on data from 1,378 Illinois zip codes.
U.S. Zip Codes
The distribution is based on data from 31,435 U.S. zip codes.
Cook, IL County Value
(10.5%)
The regional value is compared to the Cook County value.
Poor Physical Health: 14+ Days Zip Code: Hinsdale (60521)
Poor Physical Health: 14+ Days Zip Code: Hinsdale (60521)
7.4%
(2021)
Compared to:
IL Zip Codes
The distribution is based on data from 1,378 Illinois zip codes.
U.S. Zip Codes
The distribution is based on data from 31,435 U.S. zip codes.
DuPage, IL County Value
(8.8%)
The regional value is compared to the DuPage County value.
Poor Physical Health: 14+ Days Zip Code: Justice (60458)
Poor Physical Health: 14+ Days Zip Code: Justice (60458)
12.2%
(2021)
Compared to:
IL Zip Codes
The distribution is based on data from 1,378 Illinois zip codes.
U.S. Zip Codes
The distribution is based on data from 31,435 U.S. zip codes.
Cook, IL County Value
(10.5%)
The regional value is compared to the Cook County value.
Poor Physical Health: 14+ Days Zip Code: La Grange Park (60526)
Poor Physical Health: 14+ Days Zip Code: La Grange Park (60526)
8.7%
(2021)
Compared to:
IL Zip Codes
The distribution is based on data from 1,378 Illinois zip codes.
U.S. Zip Codes
The distribution is based on data from 31,435 U.S. zip codes.
Cook, IL County Value
(10.5%)
The regional value is compared to the Cook County value.
Poor Physical Health: 14+ Days Zip Code: Lyons (60534)
Poor Physical Health: 14+ Days Zip Code: Lyons (60534)
11.8%
(2021)
Compared to:
IL Zip Codes
The distribution is based on data from 1,378 Illinois zip codes.
U.S. Zip Codes
The distribution is based on data from 31,435 U.S. zip codes.
Cook, IL County Value
(10.5%)
The regional value is compared to the Cook County value.
Poor Physical Health: 14+ Days Zip Code: North Riverside, Riverside (60546)
Poor Physical Health: 14+ Days Zip Code: North Riverside, Riverside (60546)
9.3%
(2021)
Compared to:
IL Zip Codes
The distribution is based on data from 1,378 Illinois zip codes.
U.S. Zip Codes
The distribution is based on data from 31,435 U.S. zip codes.
Cook, IL County Value
(10.5%)
The regional value is compared to the Cook County value.
Poor Physical Health: 14+ Days Zip Code: Oak Brook (60523)
Poor Physical Health: 14+ Days Zip Code: Oak Brook (60523)
9.7%
(2021)
Compared to:
IL Zip Codes
The distribution is based on data from 1,378 Illinois zip codes.
U.S. Zip Codes
The distribution is based on data from 31,435 U.S. zip codes.
DuPage, IL County Value
(8.8%)
The regional value is compared to the DuPage County value.
Poor Physical Health: 14+ Days Zip Code: Stickney (60402)
Poor Physical Health: 14+ Days Zip Code: Stickney (60402)
11.2%
(2021)
Compared to:
IL Zip Codes
The distribution is based on data from 1,378 Illinois zip codes.
U.S. Zip Codes
The distribution is based on data from 31,435 U.S. zip codes.
Cook, IL County Value
(10.5%)
The regional value is compared to the Cook County value.
Poor Physical Health: 14+ Days Zip Code: Summit (60501)
Poor Physical Health: 14+ Days Zip Code: Summit (60501)
13.9%
(2021)
Compared to:
IL Zip Codes
The distribution is based on data from 1,378 Illinois zip codes.
U.S. Zip Codes
The distribution is based on data from 31,435 U.S. zip codes.
Cook, IL County Value
(10.5%)
The regional value is compared to the Cook County value.
Poor Physical Health: 14+ Days Zip Code: Westchester (60154)
Poor Physical Health: 14+ Days Zip Code: Westchester (60154)
10.0%
(2021)
Compared to:
IL Zip Codes
The distribution is based on data from 1,378 Illinois zip codes.
U.S. Zip Codes
The distribution is based on data from 31,435 U.S. zip codes.
Cook, IL County Value
(10.5%)
The regional value is compared to the Cook County value.
Poor Physical Health: 14+ Days Zip Code: Western Springs (60558)
Poor Physical Health: 14+ Days Zip Code: Western Springs (60558)
7.6%
(2021)
Compared to:
IL Zip Codes
The distribution is based on data from 1,378 Illinois zip codes.
U.S. Zip Codes
The distribution is based on data from 31,435 U.S. zip codes.
Cook, IL County Value
(10.5%)
The regional value is compared to the Cook County value.
Poor Physical Health: 14+ Days Zip Code: Westmont (60559)
Poor Physical Health: 14+ Days Zip Code: Westmont (60559)
8.7%
(2021)
Compared to:
IL Zip Codes
The distribution is based on data from 1,378 Illinois zip codes.
U.S. Zip Codes
The distribution is based on data from 31,435 U.S. zip codes.
DuPage, IL County Value
(8.8%)
The regional value is compared to the DuPage County value.
Poor Physical Health: 14+ Days Zip Code: Willow Springs (60480)
Poor Physical Health: 14+ Days Zip Code: Willow Springs (60480)
10.1%
(2021)
Compared to:
IL Zip Codes
The distribution is based on data from 1,378 Illinois zip codes.
U.S. Zip Codes
The distribution is based on data from 31,435 U.S. zip codes.
Cook, IL County Value
(10.5%)
The regional value is compared to the Cook County value.
