Search for Indicators
Access to Health and Human Services
This dashboard tracks select indicators related to accessing health and human services throughout Community Memorial Foundation's 27 communities.
Indicator Gauge Icon Legend
Legend Colors
Red is bad, green is good, blue is not statistically different/neutral.
Compared to Distribution
 the value is in the best half of communities.
 the value is in the 2nd worst quarter of communities.
 the value is in the worst quarter of communities.
Compared to Target
 meets target;
  does not meet target.
Compared to a Single Value
 lower than the comparison value;
 higher than the comparison value;
 not statistically different from comparison value.
Trend

 non-significant change over time;
 significant change over time;
  no change over time.
Compared to Prior Value
 higher than the previous measurement period;
 lower than the previous measurement period;
 no statistically different change from previous measurement period.
Health / Health Care Access & Quality
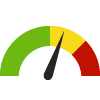
Adults who have had a Routine Checkup County: Cook
Adults who have had a Routine Checkup County: Cook
76.8%
(2021)
Compared to:

IL Counties
The distribution is based on data from 102 Illinois counties.
U.S. Counties
The distribution is based on data from 3,074 U.S. counties and county equivalents.
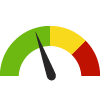
Adults who have had a Routine Checkup County: DuPage
Adults who have had a Routine Checkup County: DuPage
77.5%
(2021)
Compared to:
IL Counties
The distribution is based on data from 102 Illinois counties.
U.S. Counties
The distribution is based on data from 3,074 U.S. counties and county equivalents.
Adults with a Usual Source of Health Care County: Cook
Adults with a Usual Source of Health Care County: Cook
85.8%
(2015-2019)
Compared to:
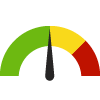
IL Counties
The distribution is based on data from 77 Illinois counties.
Prior Value
(88.4%)
Prior Value compares a measured value with the previously measured value. Confidence intervals were taken into account in determining the direction of the comparison.
Adults with a Usual Source of Health Care County: DuPage
Adults with a Usual Source of Health Care County: DuPage
85.0%
(2010-2014)
Compared to:
IL Counties
The distribution is based on data from 87 Illinois counties and county groups.
Prior Value
(88.4%)
Prior Value compares a measured value with the previously measured value. Confidence intervals were taken into account in determining the direction of the comparison.
Primary Care Provider Rate County: Cook
Primary Care Provider Rate County: Cook
92
Providers per 100,000 population
(2021)
Compared to:
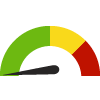

IL Counties
The distribution is based on data from 94 Illinois counties.
U.S. Counties
The distribution is based on data from 2,984 U.S. counties and county equivalents.
Prior Value
(96)
Prior Value compares a measured value with the previously measured value. Confidence intervals were not taken into account in determining the direction of the comparison.
Trend
This comparison measures the indicator’s values over multiple time periods.<br>The Mann-Kendall Test for Statistical Significance is used to evaluate the trend<br>over 4 to 10 periods of measure, subject to data availability and comparability.
Primary Care Provider Rate County: DuPage
Primary Care Provider Rate County: DuPage
135
Providers per 100,000 population
(2021)
Compared to:
IL Counties
The distribution is based on data from 94 Illinois counties.
U.S. Counties
The distribution is based on data from 2,984 U.S. counties and county equivalents.
Prior Value
(133)
Prior Value compares a measured value with the previously measured value. Confidence intervals were not taken into account in determining the direction of the comparison.
Trend
This comparison measures the indicator’s values over multiple time periods.<br>The Mann-Kendall Test for Statistical Significance is used to evaluate the trend<br>over 4 to 10 periods of measure, subject to data availability and comparability.
Persons with Health Insurance County: Cook
Persons with Health Insurance County: Cook
89.9%
(2021)
Compared to:

IL Counties
The distribution is based on data from 102 Illinois counties.
U.S. Counties
The distribution is based on data from 3,140 U.S. counties and county equivalents.
Prior Value
(89.7%)
Prior Value compares a measured value with the previously measured value. Confidence intervals were taken into account in determining the direction of the comparison.
Trend
This comparison measures the indicator’s values over multiple time periods.<br>The Mann-Kendall Test for Statistical Significance is used to evaluate the trend<br>over 4 to 10 periods of measure, subject to data availability and comparability.
Persons with Health Insurance County: DuPage
Persons with Health Insurance County: DuPage
94.2%
(2021)
Compared to:

IL Counties
The distribution is based on data from 102 Illinois counties.
U.S. Counties
The distribution is based on data from 3,140 U.S. counties and county equivalents.
Prior Value
(94.1%)
Prior Value compares a measured value with the previously measured value. Confidence intervals were taken into account in determining the direction of the comparison.
Trend
This comparison measures the indicator’s values over multiple time periods.<br>The Mann-Kendall Test for Statistical Significance is used to evaluate the trend<br>over 4 to 10 periods of measure, subject to data availability and comparability.
Health / Oral Health
Adults who Visited a Dentist County: Cook
Adults who Visited a Dentist County: Cook
62.5%
(2020)
Compared to:
IL Counties
The distribution is based on data from 102 Illinois counties.
U.S. Counties
The distribution is based on data from 3,141 U.S. counties and county equivalents.
Adults who Visited a Dentist County: DuPage
Adults who Visited a Dentist County: DuPage
71.5%
(2020)
Compared to:
IL Counties
The distribution is based on data from 102 Illinois counties.
U.S. Counties
The distribution is based on data from 3,141 U.S. counties and county equivalents.
