Search for Indicators
Better Incomes, Jobs, Education and Housing
This dashboard tracks select economic indicators throughout Community Memorial Foundation's 27 communities.
Indicator Gauge Icon Legend
Legend Colors
Red is bad, green is good, blue is not statistically different/neutral.
Compared to Distribution
 the value is in the best half of communities.
 the value is in the 2nd worst quarter of communities.
 the value is in the worst quarter of communities.
Compared to Target
 meets target;
  does not meet target.
Compared to a Single Value
 lower than the comparison value;
 higher than the comparison value;
 not statistically different from comparison value.
Trend

 non-significant change over time;
 significant change over time;
  no change over time.
Compared to Prior Value
 higher than the previous measurement period;
 lower than the previous measurement period;
 no statistically different change from previous measurement period.
Economy / Housing & Homes
Economy / Housing & Homes
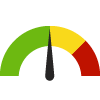
Renters Spending 30% or More of Household Income on Rent
Value
Compared to:
Renters Spending 30% or More of Household Income on Rent Zip Code: Bridgeview (60455)
Renters Spending 30% or More of Household Income on Rent Zip Code: Bridgeview (60455)
60.2%
(2018-2022)
Compared to:

IL Zip Codes
The distribution is based on data from 1,319 Illinois zip codes.
U.S. Zip Codes
The distribution is based on data from 30,131 U.S. zip codes.
Cook, IL County Value
(48.2%)
The regional value is compared to the Cook County value.
Trend
This comparison measures the indicator’s values over multiple time periods.<br>The Mann-Kendall Test for Statistical Significance is used to evaluate the trend<br>over 4 to 10 periods of measure, subject to data availability and comparability.
Renters Spending 30% or More of Household Income on Rent Zip Code: Broadview (60155)
Renters Spending 30% or More of Household Income on Rent Zip Code: Broadview (60155)
45.3%
(2018-2022)
Compared to:
IL Zip Codes
The distribution is based on data from 1,319 Illinois zip codes.
U.S. Zip Codes
The distribution is based on data from 30,131 U.S. zip codes.
Cook, IL County Value
(48.2%)
The regional value is compared to the Cook County value.
Trend
This comparison measures the indicator’s values over multiple time periods.<br>The Mann-Kendall Test for Statistical Significance is used to evaluate the trend<br>over 4 to 10 periods of measure, subject to data availability and comparability.
Renters Spending 30% or More of Household Income on Rent Zip Code: Brookfield (60513)
Renters Spending 30% or More of Household Income on Rent Zip Code: Brookfield (60513)
45.8%
(2018-2022)
Compared to:

IL Zip Codes
The distribution is based on data from 1,319 Illinois zip codes.
U.S. Zip Codes
The distribution is based on data from 30,131 U.S. zip codes.
Cook, IL County Value
(48.2%)
The regional value is compared to the Cook County value.
Trend
This comparison measures the indicator’s values over multiple time periods.<br>The Mann-Kendall Test for Statistical Significance is used to evaluate the trend<br>over 4 to 10 periods of measure, subject to data availability and comparability.
Renters Spending 30% or More of Household Income on Rent Zip Code: Burr Ridge, Willowbrook (60527)
Renters Spending 30% or More of Household Income on Rent Zip Code: Burr Ridge, Willowbrook (60527)
43.5%
(2018-2022)
Compared to:
IL Zip Codes
The distribution is based on data from 1,319 Illinois zip codes.
U.S. Zip Codes
The distribution is based on data from 30,131 U.S. zip codes.
DuPage, IL County Value
(44.2%)
The regional value is compared to the DuPage County value.
Trend
This comparison measures the indicator’s values over multiple time periods.<br>The Mann-Kendall Test for Statistical Significance is used to evaluate the trend<br>over 4 to 10 periods of measure, subject to data availability and comparability.
Renters Spending 30% or More of Household Income on Rent Zip Code: Clarendon Hills (60514)
Renters Spending 30% or More of Household Income on Rent Zip Code: Clarendon Hills (60514)
41.4%
(2018-2022)
Compared to:
IL Zip Codes
The distribution is based on data from 1,319 Illinois zip codes.
U.S. Zip Codes
The distribution is based on data from 30,131 U.S. zip codes.
DuPage, IL County Value
(44.2%)
The regional value is compared to the DuPage County value.
Trend
This comparison measures the indicator’s values over multiple time periods.<br>The Mann-Kendall Test for Statistical Significance is used to evaluate the trend<br>over 4 to 10 periods of measure, subject to data availability and comparability.
Renters Spending 30% or More of Household Income on Rent Zip Code: Countryside, Hodgkins, Indian Head Park, La Grange, McCook (60525)
Renters Spending 30% or More of Household Income on Rent Zip Code: Countryside, Hodgkins, Indian Head Park, La Grange, McCook (60525)
40.1%
(2018-2022)
Compared to:
IL Zip Codes
The distribution is based on data from 1,319 Illinois zip codes.
U.S. Zip Codes
The distribution is based on data from 30,131 U.S. zip codes.
Cook, IL County Value
(48.2%)
The regional value is compared to the Cook County value.
Trend
This comparison measures the indicator’s values over multiple time periods.<br>The Mann-Kendall Test for Statistical Significance is used to evaluate the trend<br>over 4 to 10 periods of measure, subject to data availability and comparability.
Renters Spending 30% or More of Household Income on Rent Zip Code: Darien (60561)
Renters Spending 30% or More of Household Income on Rent Zip Code: Darien (60561)
48.5%
(2018-2022)
Compared to:

IL Zip Codes
The distribution is based on data from 1,319 Illinois zip codes.
U.S. Zip Codes
The distribution is based on data from 30,131 U.S. zip codes.
DuPage, IL County Value
(44.2%)
The regional value is compared to the DuPage County value.
Trend
This comparison measures the indicator’s values over multiple time periods.<br>The Mann-Kendall Test for Statistical Significance is used to evaluate the trend<br>over 4 to 10 periods of measure, subject to data availability and comparability.
Renters Spending 30% or More of Household Income on Rent Zip Code: Downers Grove (60515)
Renters Spending 30% or More of Household Income on Rent Zip Code: Downers Grove (60515)
43.0%
(2018-2022)
Compared to:
IL Zip Codes
The distribution is based on data from 1,319 Illinois zip codes.
U.S. Zip Codes
The distribution is based on data from 30,131 U.S. zip codes.
DuPage, IL County Value
(44.2%)
The regional value is compared to the DuPage County value.
Trend
This comparison measures the indicator’s values over multiple time periods.<br>The Mann-Kendall Test for Statistical Significance is used to evaluate the trend<br>over 4 to 10 periods of measure, subject to data availability and comparability.
Renters Spending 30% or More of Household Income on Rent Zip Code: Downers Grove (60516)
Renters Spending 30% or More of Household Income on Rent Zip Code: Downers Grove (60516)
51.9%
(2018-2022)
Compared to:
IL Zip Codes
The distribution is based on data from 1,319 Illinois zip codes.
U.S. Zip Codes
The distribution is based on data from 30,131 U.S. zip codes.
DuPage, IL County Value
(44.2%)
The regional value is compared to the DuPage County value.
Trend
This comparison measures the indicator’s values over multiple time periods.<br>The Mann-Kendall Test for Statistical Significance is used to evaluate the trend<br>over 4 to 10 periods of measure, subject to data availability and comparability.
Renters Spending 30% or More of Household Income on Rent Zip Code: Hickory Hills (60457)
Renters Spending 30% or More of Household Income on Rent Zip Code: Hickory Hills (60457)
49.7%
(2018-2022)
Compared to:
IL Zip Codes
The distribution is based on data from 1,319 Illinois zip codes.
U.S. Zip Codes
The distribution is based on data from 30,131 U.S. zip codes.
Cook, IL County Value
(48.2%)
The regional value is compared to the Cook County value.
Trend
This comparison measures the indicator’s values over multiple time periods.<br>The Mann-Kendall Test for Statistical Significance is used to evaluate the trend<br>over 4 to 10 periods of measure, subject to data availability and comparability.
Renters Spending 30% or More of Household Income on Rent Zip Code: Hinsdale (60521)
Renters Spending 30% or More of Household Income on Rent Zip Code: Hinsdale (60521)
37.5%
(2018-2022)
Compared to:

IL Zip Codes
The distribution is based on data from 1,319 Illinois zip codes.
U.S. Zip Codes
The distribution is based on data from 30,131 U.S. zip codes.
DuPage, IL County Value
(44.2%)
The regional value is compared to the DuPage County value.
Trend
This comparison measures the indicator’s values over multiple time periods.<br>The Mann-Kendall Test for Statistical Significance is used to evaluate the trend<br>over 4 to 10 periods of measure, subject to data availability and comparability.
Renters Spending 30% or More of Household Income on Rent Zip Code: Justice (60458)
Renters Spending 30% or More of Household Income on Rent Zip Code: Justice (60458)
55.6%
(2018-2022)
Compared to:


IL Zip Codes
The distribution is based on data from 1,319 Illinois zip codes.
U.S. Zip Codes
The distribution is based on data from 30,131 U.S. zip codes.
Cook, IL County Value
(48.2%)
The regional value is compared to the Cook County value.
Trend
This comparison measures the indicator’s values over multiple time periods.<br>The Mann-Kendall Test for Statistical Significance is used to evaluate the trend<br>over 4 to 10 periods of measure, subject to data availability and comparability.
Renters Spending 30% or More of Household Income on Rent Zip Code: La Grange Park (60526)
Renters Spending 30% or More of Household Income on Rent Zip Code: La Grange Park (60526)
51.6%
(2018-2022)
Compared to:
IL Zip Codes
The distribution is based on data from 1,319 Illinois zip codes.
U.S. Zip Codes
The distribution is based on data from 30,131 U.S. zip codes.
Cook, IL County Value
(48.2%)
The regional value is compared to the Cook County value.
Trend
This comparison measures the indicator’s values over multiple time periods.<br>The Mann-Kendall Test for Statistical Significance is used to evaluate the trend<br>over 4 to 10 periods of measure, subject to data availability and comparability.
Renters Spending 30% or More of Household Income on Rent Zip Code: Lyons (60534)
Renters Spending 30% or More of Household Income on Rent Zip Code: Lyons (60534)
40.7%
(2018-2022)
Compared to:
IL Zip Codes
The distribution is based on data from 1,319 Illinois zip codes.
U.S. Zip Codes
The distribution is based on data from 30,131 U.S. zip codes.
Cook, IL County Value
(48.2%)
The regional value is compared to the Cook County value.
Trend
This comparison measures the indicator’s values over multiple time periods.<br>The Mann-Kendall Test for Statistical Significance is used to evaluate the trend<br>over 4 to 10 periods of measure, subject to data availability and comparability.
Renters Spending 30% or More of Household Income on Rent Zip Code: North Riverside, Riverside (60546)
Renters Spending 30% or More of Household Income on Rent Zip Code: North Riverside, Riverside (60546)
40.7%
(2018-2022)
Compared to:
IL Zip Codes
The distribution is based on data from 1,319 Illinois zip codes.
U.S. Zip Codes
The distribution is based on data from 30,131 U.S. zip codes.
Cook, IL County Value
(48.2%)
The regional value is compared to the Cook County value.
Trend
This comparison measures the indicator’s values over multiple time periods.<br>The Mann-Kendall Test for Statistical Significance is used to evaluate the trend<br>over 4 to 10 periods of measure, subject to data availability and comparability.
Renters Spending 30% or More of Household Income on Rent Zip Code: Oak Brook (60523)
Renters Spending 30% or More of Household Income on Rent Zip Code: Oak Brook (60523)
68.8%
(2018-2022)
Compared to:

IL Zip Codes
The distribution is based on data from 1,319 Illinois zip codes.
U.S. Zip Codes
The distribution is based on data from 30,131 U.S. zip codes.
DuPage, IL County Value
(44.2%)
The regional value is compared to the DuPage County value.
Trend
This comparison measures the indicator’s values over multiple time periods.<br>The Mann-Kendall Test for Statistical Significance is used to evaluate the trend<br>over 4 to 10 periods of measure, subject to data availability and comparability.
Renters Spending 30% or More of Household Income on Rent Zip Code: Stickney (60402)
Renters Spending 30% or More of Household Income on Rent Zip Code: Stickney (60402)
49.3%
(2018-2022)
Compared to:
IL Zip Codes
The distribution is based on data from 1,319 Illinois zip codes.
U.S. Zip Codes
The distribution is based on data from 30,131 U.S. zip codes.
Cook, IL County Value
(48.2%)
The regional value is compared to the Cook County value.
Trend
This comparison measures the indicator’s values over multiple time periods.<br>The Mann-Kendall Test for Statistical Significance is used to evaluate the trend<br>over 4 to 10 periods of measure, subject to data availability and comparability.
Renters Spending 30% or More of Household Income on Rent Zip Code: Summit (60501)
Renters Spending 30% or More of Household Income on Rent Zip Code: Summit (60501)
58.1%
(2018-2022)
Compared to:
IL Zip Codes
The distribution is based on data from 1,319 Illinois zip codes.
U.S. Zip Codes
The distribution is based on data from 30,131 U.S. zip codes.
Cook, IL County Value
(48.2%)
The regional value is compared to the Cook County value.
Trend
This comparison measures the indicator’s values over multiple time periods.<br>The Mann-Kendall Test for Statistical Significance is used to evaluate the trend<br>over 4 to 10 periods of measure, subject to data availability and comparability.
Renters Spending 30% or More of Household Income on Rent Zip Code: Westchester (60154)
Renters Spending 30% or More of Household Income on Rent Zip Code: Westchester (60154)
31.3%
(2018-2022)
Compared to:

IL Zip Codes
The distribution is based on data from 1,319 Illinois zip codes.
U.S. Zip Codes
The distribution is based on data from 30,131 U.S. zip codes.
Cook, IL County Value
(48.2%)
The regional value is compared to the Cook County value.
Trend
This comparison measures the indicator’s values over multiple time periods.<br>The Mann-Kendall Test for Statistical Significance is used to evaluate the trend<br>over 4 to 10 periods of measure, subject to data availability and comparability.
Renters Spending 30% or More of Household Income on Rent Zip Code: Western Springs (60558)
Renters Spending 30% or More of Household Income on Rent Zip Code: Western Springs (60558)
28.4%
(2018-2022)
Compared to:
IL Zip Codes
The distribution is based on data from 1,319 Illinois zip codes.
U.S. Zip Codes
The distribution is based on data from 30,131 U.S. zip codes.
Cook, IL County Value
(48.2%)
The regional value is compared to the Cook County value.
Trend
This comparison measures the indicator’s values over multiple time periods.<br>The Mann-Kendall Test for Statistical Significance is used to evaluate the trend<br>over 4 to 10 periods of measure, subject to data availability and comparability.
Renters Spending 30% or More of Household Income on Rent Zip Code: Westmont (60559)
Renters Spending 30% or More of Household Income on Rent Zip Code: Westmont (60559)
44.7%
(2018-2022)
Compared to:
IL Zip Codes
The distribution is based on data from 1,319 Illinois zip codes.
U.S. Zip Codes
The distribution is based on data from 30,131 U.S. zip codes.
DuPage, IL County Value
(44.2%)
The regional value is compared to the DuPage County value.
Trend
This comparison measures the indicator’s values over multiple time periods.<br>The Mann-Kendall Test for Statistical Significance is used to evaluate the trend<br>over 4 to 10 periods of measure, subject to data availability and comparability.
Renters Spending 30% or More of Household Income on Rent Zip Code: Willow Springs (60480)
Renters Spending 30% or More of Household Income on Rent Zip Code: Willow Springs (60480)
50.9%
(2018-2022)
Compared to:
IL Zip Codes
The distribution is based on data from 1,319 Illinois zip codes.
U.S. Zip Codes
The distribution is based on data from 30,131 U.S. zip codes.
Cook, IL County Value
(48.2%)
The regional value is compared to the Cook County value.
Trend
This comparison measures the indicator’s values over multiple time periods.<br>The Mann-Kendall Test for Statistical Significance is used to evaluate the trend<br>over 4 to 10 periods of measure, subject to data availability and comparability.
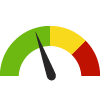
Homeownership Zip Code: Bridgeview (60455)
Homeownership Zip Code: Bridgeview (60455)
61.6%
(2018-2022)
Compared to:

IL Zip Codes
The distribution is based on data from 1,385 Illinois zip codes.
U.S. Zip Codes
The distribution is based on data from 32,828 U.S. zip codes.
Cook, IL County Value
(52.6%)
The regional value is compared to the Cook County value.
Trend
This comparison measures the indicator’s values over multiple time periods.<br>The Mann-Kendall Test for Statistical Significance is used to evaluate the trend<br>over 4 to 10 periods of measure, subject to data availability and comparability.
Homeownership Zip Code: Broadview (60155)
Homeownership Zip Code: Broadview (60155)
64.7%
(2018-2022)
Compared to:
IL Zip Codes
The distribution is based on data from 1,385 Illinois zip codes.
U.S. Zip Codes
The distribution is based on data from 32,828 U.S. zip codes.
Cook, IL County Value
(52.6%)
The regional value is compared to the Cook County value.
Trend
This comparison measures the indicator’s values over multiple time periods.<br>The Mann-Kendall Test for Statistical Significance is used to evaluate the trend<br>over 4 to 10 periods of measure, subject to data availability and comparability.
Homeownership Zip Code: Brookfield (60513)
Homeownership Zip Code: Brookfield (60513)
75.5%
(2018-2022)
Compared to:
IL Zip Codes
The distribution is based on data from 1,385 Illinois zip codes.
U.S. Zip Codes
The distribution is based on data from 32,828 U.S. zip codes.
Cook, IL County Value
(52.6%)
The regional value is compared to the Cook County value.
Trend
This comparison measures the indicator’s values over multiple time periods.<br>The Mann-Kendall Test for Statistical Significance is used to evaluate the trend<br>over 4 to 10 periods of measure, subject to data availability and comparability.
Homeownership Zip Code: Burr Ridge, Willowbrook (60527)
Homeownership Zip Code: Burr Ridge, Willowbrook (60527)
71.8%
(2018-2022)
Compared to:
IL Zip Codes
The distribution is based on data from 1,385 Illinois zip codes.
U.S. Zip Codes
The distribution is based on data from 32,828 U.S. zip codes.
DuPage, IL County Value
(69.8%)
The regional value is compared to the DuPage County value.
Trend
This comparison measures the indicator’s values over multiple time periods.<br>The Mann-Kendall Test for Statistical Significance is used to evaluate the trend<br>over 4 to 10 periods of measure, subject to data availability and comparability.
Homeownership Zip Code: Clarendon Hills (60514)
Homeownership Zip Code: Clarendon Hills (60514)
78.3%
(2018-2022)
Compared to:
IL Zip Codes
The distribution is based on data from 1,385 Illinois zip codes.
U.S. Zip Codes
The distribution is based on data from 32,828 U.S. zip codes.
DuPage, IL County Value
(69.8%)
The regional value is compared to the DuPage County value.
Trend
This comparison measures the indicator’s values over multiple time periods.<br>The Mann-Kendall Test for Statistical Significance is used to evaluate the trend<br>over 4 to 10 periods of measure, subject to data availability and comparability.
75.3%
(2018-2022)
Compared to:
IL Zip Codes
The distribution is based on data from 1,385 Illinois zip codes.
U.S. Zip Codes
The distribution is based on data from 32,828 U.S. zip codes.
Cook, IL County Value
(52.6%)
The regional value is compared to the Cook County value.
Trend
This comparison measures the indicator’s values over multiple time periods.<br>The Mann-Kendall Test for Statistical Significance is used to evaluate the trend<br>over 4 to 10 periods of measure, subject to data availability and comparability.
Homeownership Zip Code: Darien (60561)
Homeownership Zip Code: Darien (60561)
77.9%
(2018-2022)
Compared to:
IL Zip Codes
The distribution is based on data from 1,385 Illinois zip codes.
U.S. Zip Codes
The distribution is based on data from 32,828 U.S. zip codes.
DuPage, IL County Value
(69.8%)
The regional value is compared to the DuPage County value.
Trend
This comparison measures the indicator’s values over multiple time periods.<br>The Mann-Kendall Test for Statistical Significance is used to evaluate the trend<br>over 4 to 10 periods of measure, subject to data availability and comparability.
Homeownership Zip Code: Downers Grove (60515)
Homeownership Zip Code: Downers Grove (60515)
73.6%
(2018-2022)
Compared to:
IL Zip Codes
The distribution is based on data from 1,385 Illinois zip codes.
U.S. Zip Codes
The distribution is based on data from 32,828 U.S. zip codes.
DuPage, IL County Value
(69.8%)
The regional value is compared to the DuPage County value.
Trend
This comparison measures the indicator’s values over multiple time periods.<br>The Mann-Kendall Test for Statistical Significance is used to evaluate the trend<br>over 4 to 10 periods of measure, subject to data availability and comparability.
Homeownership Zip Code: Downers Grove (60516)
Homeownership Zip Code: Downers Grove (60516)
74.4%
(2018-2022)
Compared to:

IL Zip Codes
The distribution is based on data from 1,385 Illinois zip codes.
U.S. Zip Codes
The distribution is based on data from 32,828 U.S. zip codes.
DuPage, IL County Value
(69.8%)
The regional value is compared to the DuPage County value.
Trend
This comparison measures the indicator’s values over multiple time periods.<br>The Mann-Kendall Test for Statistical Significance is used to evaluate the trend<br>over 4 to 10 periods of measure, subject to data availability and comparability.
Homeownership Zip Code: Hickory Hills (60457)
Homeownership Zip Code: Hickory Hills (60457)
69.2%
(2018-2022)
Compared to:
IL Zip Codes
The distribution is based on data from 1,385 Illinois zip codes.
U.S. Zip Codes
The distribution is based on data from 32,828 U.S. zip codes.
Cook, IL County Value
(52.6%)
The regional value is compared to the Cook County value.
Trend
This comparison measures the indicator’s values over multiple time periods.<br>The Mann-Kendall Test for Statistical Significance is used to evaluate the trend<br>over 4 to 10 periods of measure, subject to data availability and comparability.
Homeownership Zip Code: Hinsdale (60521)
Homeownership Zip Code: Hinsdale (60521)
81.6%
(2018-2022)
Compared to:
IL Zip Codes
The distribution is based on data from 1,385 Illinois zip codes.
U.S. Zip Codes
The distribution is based on data from 32,828 U.S. zip codes.
DuPage, IL County Value
(69.8%)
The regional value is compared to the DuPage County value.
Trend
This comparison measures the indicator’s values over multiple time periods.<br>The Mann-Kendall Test for Statistical Significance is used to evaluate the trend<br>over 4 to 10 periods of measure, subject to data availability and comparability.
Homeownership Zip Code: Justice (60458)
Homeownership Zip Code: Justice (60458)
48.5%
(2018-2022)
Compared to:

IL Zip Codes
The distribution is based on data from 1,385 Illinois zip codes.
U.S. Zip Codes
The distribution is based on data from 32,828 U.S. zip codes.
Cook, IL County Value
(52.6%)
The regional value is compared to the Cook County value.
Trend
This comparison measures the indicator’s values over multiple time periods.<br>The Mann-Kendall Test for Statistical Significance is used to evaluate the trend<br>over 4 to 10 periods of measure, subject to data availability and comparability.
Homeownership Zip Code: La Grange Park (60526)
Homeownership Zip Code: La Grange Park (60526)
67.8%
(2018-2022)
Compared to:
IL Zip Codes
The distribution is based on data from 1,385 Illinois zip codes.
U.S. Zip Codes
The distribution is based on data from 32,828 U.S. zip codes.
Cook, IL County Value
(52.6%)
The regional value is compared to the Cook County value.
Trend
This comparison measures the indicator’s values over multiple time periods.<br>The Mann-Kendall Test for Statistical Significance is used to evaluate the trend<br>over 4 to 10 periods of measure, subject to data availability and comparability.
Homeownership Zip Code: Lyons (60534)
Homeownership Zip Code: Lyons (60534)
59.5%
(2018-2022)
Compared to:
IL Zip Codes
The distribution is based on data from 1,385 Illinois zip codes.
U.S. Zip Codes
The distribution is based on data from 32,828 U.S. zip codes.
Cook, IL County Value
(52.6%)
The regional value is compared to the Cook County value.
Trend
This comparison measures the indicator’s values over multiple time periods.<br>The Mann-Kendall Test for Statistical Significance is used to evaluate the trend<br>over 4 to 10 periods of measure, subject to data availability and comparability.
Homeownership Zip Code: North Riverside, Riverside (60546)
Homeownership Zip Code: North Riverside, Riverside (60546)
72.0%
(2018-2022)
Compared to:
IL Zip Codes
The distribution is based on data from 1,385 Illinois zip codes.
U.S. Zip Codes
The distribution is based on data from 32,828 U.S. zip codes.
Cook, IL County Value
(52.6%)
The regional value is compared to the Cook County value.
Trend
This comparison measures the indicator’s values over multiple time periods.<br>The Mann-Kendall Test for Statistical Significance is used to evaluate the trend<br>over 4 to 10 periods of measure, subject to data availability and comparability.
Homeownership Zip Code: Oak Brook (60523)
Homeownership Zip Code: Oak Brook (60523)
74.8%
(2018-2022)
Compared to:
IL Zip Codes
The distribution is based on data from 1,385 Illinois zip codes.
U.S. Zip Codes
The distribution is based on data from 32,828 U.S. zip codes.
DuPage, IL County Value
(69.8%)
The regional value is compared to the DuPage County value.
Trend
This comparison measures the indicator’s values over multiple time periods.<br>The Mann-Kendall Test for Statistical Significance is used to evaluate the trend<br>over 4 to 10 periods of measure, subject to data availability and comparability.
Homeownership Zip Code: Stickney (60402)
Homeownership Zip Code: Stickney (60402)
58.6%
(2018-2022)
Compared to:
IL Zip Codes
The distribution is based on data from 1,385 Illinois zip codes.
U.S. Zip Codes
The distribution is based on data from 32,828 U.S. zip codes.
Cook, IL County Value
(52.6%)
The regional value is compared to the Cook County value.
Trend
This comparison measures the indicator’s values over multiple time periods.<br>The Mann-Kendall Test for Statistical Significance is used to evaluate the trend<br>over 4 to 10 periods of measure, subject to data availability and comparability.
Homeownership Zip Code: Summit (60501)
Homeownership Zip Code: Summit (60501)
55.1%
(2018-2022)
Compared to:
IL Zip Codes
The distribution is based on data from 1,385 Illinois zip codes.
U.S. Zip Codes
The distribution is based on data from 32,828 U.S. zip codes.
Cook, IL County Value
(52.6%)
The regional value is compared to the Cook County value.
Trend
This comparison measures the indicator’s values over multiple time periods.<br>The Mann-Kendall Test for Statistical Significance is used to evaluate the trend<br>over 4 to 10 periods of measure, subject to data availability and comparability.
Homeownership Zip Code: Westchester (60154)
Homeownership Zip Code: Westchester (60154)
87.5%
(2018-2022)
Compared to:

IL Zip Codes
The distribution is based on data from 1,385 Illinois zip codes.
U.S. Zip Codes
The distribution is based on data from 32,828 U.S. zip codes.
Cook, IL County Value
(52.6%)
The regional value is compared to the Cook County value.
Trend
This comparison measures the indicator’s values over multiple time periods.<br>The Mann-Kendall Test for Statistical Significance is used to evaluate the trend<br>over 4 to 10 periods of measure, subject to data availability and comparability.
Homeownership Zip Code: Western Springs (60558)
Homeownership Zip Code: Western Springs (60558)
94.1%
(2018-2022)
Compared to:
IL Zip Codes
The distribution is based on data from 1,385 Illinois zip codes.
U.S. Zip Codes
The distribution is based on data from 32,828 U.S. zip codes.
Cook, IL County Value
(52.6%)
The regional value is compared to the Cook County value.
Trend
This comparison measures the indicator’s values over multiple time periods.<br>The Mann-Kendall Test for Statistical Significance is used to evaluate the trend<br>over 4 to 10 periods of measure, subject to data availability and comparability.
Homeownership Zip Code: Westmont (60559)
Homeownership Zip Code: Westmont (60559)
52.9%
(2018-2022)
Compared to:
IL Zip Codes
The distribution is based on data from 1,385 Illinois zip codes.
U.S. Zip Codes
The distribution is based on data from 32,828 U.S. zip codes.
DuPage, IL County Value
(69.8%)
The regional value is compared to the DuPage County value.
Trend
This comparison measures the indicator’s values over multiple time periods.<br>The Mann-Kendall Test for Statistical Significance is used to evaluate the trend<br>over 4 to 10 periods of measure, subject to data availability and comparability.
Homeownership Zip Code: Willow Springs (60480)
Homeownership Zip Code: Willow Springs (60480)
80.0%
(2018-2022)
Compared to:
IL Zip Codes
The distribution is based on data from 1,385 Illinois zip codes.
U.S. Zip Codes
The distribution is based on data from 32,828 U.S. zip codes.
Cook, IL County Value
(52.6%)
The regional value is compared to the Cook County value.
Trend
This comparison measures the indicator’s values over multiple time periods.<br>The Mann-Kendall Test for Statistical Significance is used to evaluate the trend<br>over 4 to 10 periods of measure, subject to data availability and comparability.
Overcrowded Households Zip Code: Bridgeview (60455)
Overcrowded Households Zip Code: Bridgeview (60455)
4.8%
(2018-2022)
Compared to:
IL Zip Codes
The distribution is based on data from 1,384 Illinois zip codes.
Cook, IL County Value
(3.2%)
The regional value is compared to the Cook County value.
Trend
This comparison measures the indicator’s values over multiple time periods.<br>The Mann-Kendall Test for Statistical Significance is used to evaluate the trend<br>over 4 to 10 periods of measure, subject to data availability and comparability.
Overcrowded Households Zip Code: Broadview (60155)
Overcrowded Households Zip Code: Broadview (60155)
0.9%
(2018-2022)
Compared to:
IL Zip Codes
The distribution is based on data from 1,384 Illinois zip codes.
Cook, IL County Value
(3.2%)
The regional value is compared to the Cook County value.
Trend
This comparison measures the indicator’s values over multiple time periods.<br>The Mann-Kendall Test for Statistical Significance is used to evaluate the trend<br>over 4 to 10 periods of measure, subject to data availability and comparability.
Overcrowded Households Zip Code: Brookfield (60513)
Overcrowded Households Zip Code: Brookfield (60513)
0.5%
(2018-2022)
Compared to:
IL Zip Codes
The distribution is based on data from 1,384 Illinois zip codes.
Cook, IL County Value
(3.2%)
The regional value is compared to the Cook County value.
Trend
This comparison measures the indicator’s values over multiple time periods.<br>The Mann-Kendall Test for Statistical Significance is used to evaluate the trend<br>over 4 to 10 periods of measure, subject to data availability and comparability.
Overcrowded Households Zip Code: Burr Ridge, Willowbrook (60527)
Overcrowded Households Zip Code: Burr Ridge, Willowbrook (60527)
1.3%
(2018-2022)
Compared to:
IL Zip Codes
The distribution is based on data from 1,384 Illinois zip codes.
DuPage, IL County Value
(2.5%)
The regional value is compared to the DuPage County value.
Trend
This comparison measures the indicator’s values over multiple time periods.<br>The Mann-Kendall Test for Statistical Significance is used to evaluate the trend<br>over 4 to 10 periods of measure, subject to data availability and comparability.
Overcrowded Households Zip Code: Clarendon Hills (60514)
Overcrowded Households Zip Code: Clarendon Hills (60514)
0.0%
(2018-2022)
Compared to:
IL Zip Codes
The distribution is based on data from 1,384 Illinois zip codes.
DuPage, IL County Value
(2.5%)
The regional value is compared to the DuPage County value.
Trend
This comparison measures the indicator’s values over multiple time periods.<br>The Mann-Kendall Test for Statistical Significance is used to evaluate the trend<br>over 4 to 10 periods of measure, subject to data availability and comparability.
Overcrowded Households Zip Code: Countryside, Hodgkins, Indian Head Park, La Grange, McCook (60525)
Overcrowded Households Zip Code: Countryside, Hodgkins, Indian Head Park, La Grange, McCook (60525)
1.7%
(2018-2022)
Compared to:
IL Zip Codes
The distribution is based on data from 1,384 Illinois zip codes.
Cook, IL County Value
(3.2%)
The regional value is compared to the Cook County value.
Trend
This comparison measures the indicator’s values over multiple time periods.<br>The Mann-Kendall Test for Statistical Significance is used to evaluate the trend<br>over 4 to 10 periods of measure, subject to data availability and comparability.
Overcrowded Households Zip Code: Darien (60561)
Overcrowded Households Zip Code: Darien (60561)
0.4%
(2018-2022)
Compared to:
IL Zip Codes
The distribution is based on data from 1,384 Illinois zip codes.
DuPage, IL County Value
(2.5%)
The regional value is compared to the DuPage County value.
Trend
This comparison measures the indicator’s values over multiple time periods.<br>The Mann-Kendall Test for Statistical Significance is used to evaluate the trend<br>over 4 to 10 periods of measure, subject to data availability and comparability.
Overcrowded Households Zip Code: Downers Grove (60515)
Overcrowded Households Zip Code: Downers Grove (60515)
2.3%
(2018-2022)
Compared to:
IL Zip Codes
The distribution is based on data from 1,384 Illinois zip codes.
DuPage, IL County Value
(2.5%)
The regional value is compared to the DuPage County value.
Trend
This comparison measures the indicator’s values over multiple time periods.<br>The Mann-Kendall Test for Statistical Significance is used to evaluate the trend<br>over 4 to 10 periods of measure, subject to data availability and comparability.
Overcrowded Households Zip Code: Downers Grove (60516)
Overcrowded Households Zip Code: Downers Grove (60516)
0.6%
(2018-2022)
Compared to:
IL Zip Codes
The distribution is based on data from 1,384 Illinois zip codes.
DuPage, IL County Value
(2.5%)
The regional value is compared to the DuPage County value.
Trend
This comparison measures the indicator’s values over multiple time periods.<br>The Mann-Kendall Test for Statistical Significance is used to evaluate the trend<br>over 4 to 10 periods of measure, subject to data availability and comparability.
Overcrowded Households Zip Code: Hickory Hills (60457)
Overcrowded Households Zip Code: Hickory Hills (60457)
5.6%
(2018-2022)
Compared to:
IL Zip Codes
The distribution is based on data from 1,384 Illinois zip codes.
Cook, IL County Value
(3.2%)
The regional value is compared to the Cook County value.
Trend
This comparison measures the indicator’s values over multiple time periods.<br>The Mann-Kendall Test for Statistical Significance is used to evaluate the trend<br>over 4 to 10 periods of measure, subject to data availability and comparability.
Overcrowded Households Zip Code: Hinsdale (60521)
Overcrowded Households Zip Code: Hinsdale (60521)
0.7%
(2018-2022)
Compared to:
IL Zip Codes
The distribution is based on data from 1,384 Illinois zip codes.
DuPage, IL County Value
(2.5%)
The regional value is compared to the DuPage County value.
Trend
This comparison measures the indicator’s values over multiple time periods.<br>The Mann-Kendall Test for Statistical Significance is used to evaluate the trend<br>over 4 to 10 periods of measure, subject to data availability and comparability.
Overcrowded Households Zip Code: Justice (60458)
Overcrowded Households Zip Code: Justice (60458)
6.2%
(2018-2022)
Compared to:
IL Zip Codes
The distribution is based on data from 1,384 Illinois zip codes.
Cook, IL County Value
(3.2%)
The regional value is compared to the Cook County value.
Trend
This comparison measures the indicator’s values over multiple time periods.<br>The Mann-Kendall Test for Statistical Significance is used to evaluate the trend<br>over 4 to 10 periods of measure, subject to data availability and comparability.
Overcrowded Households Zip Code: La Grange Park (60526)
Overcrowded Households Zip Code: La Grange Park (60526)
0.0%
(2018-2022)
Compared to:
IL Zip Codes
The distribution is based on data from 1,384 Illinois zip codes.
Cook, IL County Value
(3.2%)
The regional value is compared to the Cook County value.
Trend
This comparison measures the indicator’s values over multiple time periods.<br>The Mann-Kendall Test for Statistical Significance is used to evaluate the trend<br>over 4 to 10 periods of measure, subject to data availability and comparability.
Overcrowded Households Zip Code: Lyons (60534)
Overcrowded Households Zip Code: Lyons (60534)
2.5%
(2018-2022)
Compared to:
IL Zip Codes
The distribution is based on data from 1,384 Illinois zip codes.
Cook, IL County Value
(3.2%)
The regional value is compared to the Cook County value.
Trend
This comparison measures the indicator’s values over multiple time periods.<br>The Mann-Kendall Test for Statistical Significance is used to evaluate the trend<br>over 4 to 10 periods of measure, subject to data availability and comparability.
Overcrowded Households Zip Code: North Riverside, Riverside (60546)
Overcrowded Households Zip Code: North Riverside, Riverside (60546)
2.0%
(2018-2022)
Compared to:
IL Zip Codes
The distribution is based on data from 1,384 Illinois zip codes.
Cook, IL County Value
(3.2%)
The regional value is compared to the Cook County value.
Trend
This comparison measures the indicator’s values over multiple time periods.<br>The Mann-Kendall Test for Statistical Significance is used to evaluate the trend<br>over 4 to 10 periods of measure, subject to data availability and comparability.
Overcrowded Households Zip Code: Oak Brook (60523)
Overcrowded Households Zip Code: Oak Brook (60523)
0.5%
(2018-2022)
Compared to:
IL Zip Codes
The distribution is based on data from 1,384 Illinois zip codes.
DuPage, IL County Value
(2.5%)
The regional value is compared to the DuPage County value.
Trend
This comparison measures the indicator’s values over multiple time periods.<br>The Mann-Kendall Test for Statistical Significance is used to evaluate the trend<br>over 4 to 10 periods of measure, subject to data availability and comparability.
Overcrowded Households Zip Code: Stickney (60402)
Overcrowded Households Zip Code: Stickney (60402)
3.6%
(2018-2022)
Compared to:
IL Zip Codes
The distribution is based on data from 1,384 Illinois zip codes.
Cook, IL County Value
(3.2%)
The regional value is compared to the Cook County value.
Trend
This comparison measures the indicator’s values over multiple time periods.<br>The Mann-Kendall Test for Statistical Significance is used to evaluate the trend<br>over 4 to 10 periods of measure, subject to data availability and comparability.
Overcrowded Households Zip Code: Summit (60501)
Overcrowded Households Zip Code: Summit (60501)
8.1%
(2018-2022)
Compared to:
IL Zip Codes
The distribution is based on data from 1,384 Illinois zip codes.
Cook, IL County Value
(3.2%)
The regional value is compared to the Cook County value.
Trend
This comparison measures the indicator’s values over multiple time periods.<br>The Mann-Kendall Test for Statistical Significance is used to evaluate the trend<br>over 4 to 10 periods of measure, subject to data availability and comparability.
Overcrowded Households Zip Code: Westchester (60154)
Overcrowded Households Zip Code: Westchester (60154)
0.1%
(2018-2022)
Compared to:
IL Zip Codes
The distribution is based on data from 1,384 Illinois zip codes.
Cook, IL County Value
(3.2%)
The regional value is compared to the Cook County value.
Trend
This comparison measures the indicator’s values over multiple time periods.<br>The Mann-Kendall Test for Statistical Significance is used to evaluate the trend<br>over 4 to 10 periods of measure, subject to data availability and comparability.
Overcrowded Households Zip Code: Western Springs (60558)
Overcrowded Households Zip Code: Western Springs (60558)
0.0%
(2018-2022)
Compared to:
IL Zip Codes
The distribution is based on data from 1,384 Illinois zip codes.
Cook, IL County Value
(3.2%)
The regional value is compared to the Cook County value.
Trend
This comparison measures the indicator’s values over multiple time periods.<br>The Mann-Kendall Test for Statistical Significance is used to evaluate the trend<br>over 4 to 10 periods of measure, subject to data availability and comparability.
Overcrowded Households Zip Code: Westmont (60559)
Overcrowded Households Zip Code: Westmont (60559)
3.0%
(2018-2022)
Compared to:
IL Zip Codes
The distribution is based on data from 1,384 Illinois zip codes.
DuPage, IL County Value
(2.5%)
The regional value is compared to the DuPage County value.
Trend
This comparison measures the indicator’s values over multiple time periods.<br>The Mann-Kendall Test for Statistical Significance is used to evaluate the trend<br>over 4 to 10 periods of measure, subject to data availability and comparability.
Overcrowded Households Zip Code: Willow Springs (60480)
Overcrowded Households Zip Code: Willow Springs (60480)
0.5%
(2018-2022)
Compared to:
IL Zip Codes
The distribution is based on data from 1,384 Illinois zip codes.
Cook, IL County Value
(3.2%)
The regional value is compared to the Cook County value.
Trend
This comparison measures the indicator’s values over multiple time periods.<br>The Mann-Kendall Test for Statistical Significance is used to evaluate the trend<br>over 4 to 10 periods of measure, subject to data availability and comparability.
Economy / Income
Median Household Income Zip Code: Bridgeview (60455)
Median Household Income Zip Code: Bridgeview (60455)
$61,273
(2018-2022)
Compared to:
IL Zip Codes
The distribution is based on data from 1,338 Illinois zip codes.
U.S. Zip Codes
The distribution is based on data from 30,405 U.S. zip codes.
Cook, IL County Value
($78,304)
The regional value is compared to the Cook County value.
Trend
This comparison measures the indicator’s values over multiple time periods.<br>The Mann-Kendall Test for Statistical Significance is used to evaluate the trend<br>over 4 to 10 periods of measure, subject to data availability and comparability.
Median Household Income Zip Code: Broadview (60155)
Median Household Income Zip Code: Broadview (60155)
$58,807
(2018-2022)
Compared to:
IL Zip Codes
The distribution is based on data from 1,338 Illinois zip codes.
U.S. Zip Codes
The distribution is based on data from 30,405 U.S. zip codes.
Cook, IL County Value
($78,304)
The regional value is compared to the Cook County value.
Trend
This comparison measures the indicator’s values over multiple time periods.<br>The Mann-Kendall Test for Statistical Significance is used to evaluate the trend<br>over 4 to 10 periods of measure, subject to data availability and comparability.
Median Household Income Zip Code: Brookfield (60513)
Median Household Income Zip Code: Brookfield (60513)
$98,984
(2018-2022)
Compared to:
IL Zip Codes
The distribution is based on data from 1,338 Illinois zip codes.
U.S. Zip Codes
The distribution is based on data from 30,405 U.S. zip codes.
Cook, IL County Value
($78,304)
The regional value is compared to the Cook County value.
Trend
This comparison measures the indicator’s values over multiple time periods.<br>The Mann-Kendall Test for Statistical Significance is used to evaluate the trend<br>over 4 to 10 periods of measure, subject to data availability and comparability.
Median Household Income Zip Code: Burr Ridge, Willowbrook (60527)
Median Household Income Zip Code: Burr Ridge, Willowbrook (60527)
$115,318
(2018-2022)
Compared to:
IL Zip Codes
The distribution is based on data from 1,338 Illinois zip codes.
U.S. Zip Codes
The distribution is based on data from 30,405 U.S. zip codes.
DuPage, IL County Value
($107,035)
The regional value is compared to the DuPage County value.
Trend
This comparison measures the indicator’s values over multiple time periods.<br>The Mann-Kendall Test for Statistical Significance is used to evaluate the trend<br>over 4 to 10 periods of measure, subject to data availability and comparability.
Median Household Income Zip Code: Clarendon Hills (60514)
Median Household Income Zip Code: Clarendon Hills (60514)
$108,175
(2018-2022)
Compared to:
IL Zip Codes
The distribution is based on data from 1,338 Illinois zip codes.
U.S. Zip Codes
The distribution is based on data from 30,405 U.S. zip codes.
DuPage, IL County Value
($107,035)
The regional value is compared to the DuPage County value.
Trend
This comparison measures the indicator’s values over multiple time periods.<br>The Mann-Kendall Test for Statistical Significance is used to evaluate the trend<br>over 4 to 10 periods of measure, subject to data availability and comparability.
Median Household Income Zip Code: Countryside, Hodgkins, Indian Head Park, La Grange, McCook (60525)
Median Household Income Zip Code: Countryside, Hodgkins, Indian Head Park, La Grange, McCook (60525)
$108,941
(2018-2022)
Compared to:
IL Zip Codes
The distribution is based on data from 1,338 Illinois zip codes.
U.S. Zip Codes
The distribution is based on data from 30,405 U.S. zip codes.
Cook, IL County Value
($78,304)
The regional value is compared to the Cook County value.
Trend
This comparison measures the indicator’s values over multiple time periods.<br>The Mann-Kendall Test for Statistical Significance is used to evaluate the trend<br>over 4 to 10 periods of measure, subject to data availability and comparability.
Median Household Income Zip Code: Darien (60561)
Median Household Income Zip Code: Darien (60561)
$110,061
(2018-2022)
Compared to:
IL Zip Codes
The distribution is based on data from 1,338 Illinois zip codes.
U.S. Zip Codes
The distribution is based on data from 30,405 U.S. zip codes.
DuPage, IL County Value
($107,035)
The regional value is compared to the DuPage County value.
Trend
This comparison measures the indicator’s values over multiple time periods.<br>The Mann-Kendall Test for Statistical Significance is used to evaluate the trend<br>over 4 to 10 periods of measure, subject to data availability and comparability.
Median Household Income Zip Code: Downers Grove (60515)
Median Household Income Zip Code: Downers Grove (60515)
$116,601
(2018-2022)
Compared to:
IL Zip Codes
The distribution is based on data from 1,338 Illinois zip codes.
U.S. Zip Codes
The distribution is based on data from 30,405 U.S. zip codes.
DuPage, IL County Value
($107,035)
The regional value is compared to the DuPage County value.
Trend
This comparison measures the indicator’s values over multiple time periods.<br>The Mann-Kendall Test for Statistical Significance is used to evaluate the trend<br>over 4 to 10 periods of measure, subject to data availability and comparability.
Median Household Income Zip Code: Downers Grove (60516)
Median Household Income Zip Code: Downers Grove (60516)
$113,032
(2018-2022)
Compared to:
IL Zip Codes
The distribution is based on data from 1,338 Illinois zip codes.
U.S. Zip Codes
The distribution is based on data from 30,405 U.S. zip codes.
DuPage, IL County Value
($107,035)
The regional value is compared to the DuPage County value.
Trend
This comparison measures the indicator’s values over multiple time periods.<br>The Mann-Kendall Test for Statistical Significance is used to evaluate the trend<br>over 4 to 10 periods of measure, subject to data availability and comparability.
Median Household Income Zip Code: Hickory Hills (60457)
Median Household Income Zip Code: Hickory Hills (60457)
$81,723
(2018-2022)
Compared to:
IL Zip Codes
The distribution is based on data from 1,338 Illinois zip codes.
U.S. Zip Codes
The distribution is based on data from 30,405 U.S. zip codes.
Cook, IL County Value
($78,304)
The regional value is compared to the Cook County value.
Trend
This comparison measures the indicator’s values over multiple time periods.<br>The Mann-Kendall Test for Statistical Significance is used to evaluate the trend<br>over 4 to 10 periods of measure, subject to data availability and comparability.
Median Household Income Zip Code: Hinsdale (60521)
Median Household Income Zip Code: Hinsdale (60521)
$242,462
(2018-2022)
Compared to:
IL Zip Codes
The distribution is based on data from 1,338 Illinois zip codes.
U.S. Zip Codes
The distribution is based on data from 30,405 U.S. zip codes.
DuPage, IL County Value
($107,035)
The regional value is compared to the DuPage County value.
Trend
This comparison measures the indicator’s values over multiple time periods.<br>The Mann-Kendall Test for Statistical Significance is used to evaluate the trend<br>over 4 to 10 periods of measure, subject to data availability and comparability.
Median Household Income Zip Code: Justice (60458)
Median Household Income Zip Code: Justice (60458)
$59,077
(2018-2022)
Compared to:
IL Zip Codes
The distribution is based on data from 1,338 Illinois zip codes.
U.S. Zip Codes
The distribution is based on data from 30,405 U.S. zip codes.
Cook, IL County Value
($78,304)
The regional value is compared to the Cook County value.
Trend
This comparison measures the indicator’s values over multiple time periods.<br>The Mann-Kendall Test for Statistical Significance is used to evaluate the trend<br>over 4 to 10 periods of measure, subject to data availability and comparability.
Median Household Income Zip Code: La Grange Park (60526)
Median Household Income Zip Code: La Grange Park (60526)
$113,210
(2018-2022)
Compared to:
IL Zip Codes
The distribution is based on data from 1,338 Illinois zip codes.
U.S. Zip Codes
The distribution is based on data from 30,405 U.S. zip codes.
Cook, IL County Value
($78,304)
The regional value is compared to the Cook County value.
Trend
This comparison measures the indicator’s values over multiple time periods.<br>The Mann-Kendall Test for Statistical Significance is used to evaluate the trend<br>over 4 to 10 periods of measure, subject to data availability and comparability.
Median Household Income Zip Code: Lyons (60534)
Median Household Income Zip Code: Lyons (60534)
$59,327
(2018-2022)
Compared to:
IL Zip Codes
The distribution is based on data from 1,338 Illinois zip codes.
U.S. Zip Codes
The distribution is based on data from 30,405 U.S. zip codes.
Cook, IL County Value
($78,304)
The regional value is compared to the Cook County value.
Trend
This comparison measures the indicator’s values over multiple time periods.<br>The Mann-Kendall Test for Statistical Significance is used to evaluate the trend<br>over 4 to 10 periods of measure, subject to data availability and comparability.
Median Household Income Zip Code: North Riverside, Riverside (60546)
Median Household Income Zip Code: North Riverside, Riverside (60546)
$106,967
(2018-2022)
Compared to:
IL Zip Codes
The distribution is based on data from 1,338 Illinois zip codes.
U.S. Zip Codes
The distribution is based on data from 30,405 U.S. zip codes.
Cook, IL County Value
($78,304)
The regional value is compared to the Cook County value.
Trend
This comparison measures the indicator’s values over multiple time periods.<br>The Mann-Kendall Test for Statistical Significance is used to evaluate the trend<br>over 4 to 10 periods of measure, subject to data availability and comparability.
Median Household Income Zip Code: Oak Brook (60523)
Median Household Income Zip Code: Oak Brook (60523)
$106,185
(2018-2022)
Compared to:
IL Zip Codes
The distribution is based on data from 1,338 Illinois zip codes.
U.S. Zip Codes
The distribution is based on data from 30,405 U.S. zip codes.
DuPage, IL County Value
($107,035)
The regional value is compared to the DuPage County value.
Trend
This comparison measures the indicator’s values over multiple time periods.<br>The Mann-Kendall Test for Statistical Significance is used to evaluate the trend<br>over 4 to 10 periods of measure, subject to data availability and comparability.
Median Household Income Zip Code: Stickney (60402)
Median Household Income Zip Code: Stickney (60402)
$71,449
(2018-2022)
Compared to:
IL Zip Codes
The distribution is based on data from 1,338 Illinois zip codes.
U.S. Zip Codes
The distribution is based on data from 30,405 U.S. zip codes.
Cook, IL County Value
($78,304)
The regional value is compared to the Cook County value.
Trend
This comparison measures the indicator’s values over multiple time periods.<br>The Mann-Kendall Test for Statistical Significance is used to evaluate the trend<br>over 4 to 10 periods of measure, subject to data availability and comparability.
Median Household Income Zip Code: Summit (60501)
Median Household Income Zip Code: Summit (60501)
$55,429
(2018-2022)
Compared to:
IL Zip Codes
The distribution is based on data from 1,338 Illinois zip codes.
U.S. Zip Codes
The distribution is based on data from 30,405 U.S. zip codes.
Cook, IL County Value
($78,304)
The regional value is compared to the Cook County value.
Trend
This comparison measures the indicator’s values over multiple time periods.<br>The Mann-Kendall Test for Statistical Significance is used to evaluate the trend<br>over 4 to 10 periods of measure, subject to data availability and comparability.
Median Household Income Zip Code: Westchester (60154)
Median Household Income Zip Code: Westchester (60154)
$101,414
(2018-2022)
Compared to:
IL Zip Codes
The distribution is based on data from 1,338 Illinois zip codes.
U.S. Zip Codes
The distribution is based on data from 30,405 U.S. zip codes.
Cook, IL County Value
($78,304)
The regional value is compared to the Cook County value.
Trend
This comparison measures the indicator’s values over multiple time periods.<br>The Mann-Kendall Test for Statistical Significance is used to evaluate the trend<br>over 4 to 10 periods of measure, subject to data availability and comparability.
Median Household Income Zip Code: Western Springs (60558)
Median Household Income Zip Code: Western Springs (60558)
$198,836
(2018-2022)
Compared to:
IL Zip Codes
The distribution is based on data from 1,338 Illinois zip codes.
U.S. Zip Codes
The distribution is based on data from 30,405 U.S. zip codes.
Cook, IL County Value
($78,304)
The regional value is compared to the Cook County value.
Trend
This comparison measures the indicator’s values over multiple time periods.<br>The Mann-Kendall Test for Statistical Significance is used to evaluate the trend<br>over 4 to 10 periods of measure, subject to data availability and comparability.
Median Household Income Zip Code: Westmont (60559)
Median Household Income Zip Code: Westmont (60559)
$88,290
(2018-2022)
Compared to:
IL Zip Codes
The distribution is based on data from 1,338 Illinois zip codes.
U.S. Zip Codes
The distribution is based on data from 30,405 U.S. zip codes.
DuPage, IL County Value
($107,035)
The regional value is compared to the DuPage County value.
Trend
This comparison measures the indicator’s values over multiple time periods.<br>The Mann-Kendall Test for Statistical Significance is used to evaluate the trend<br>over 4 to 10 periods of measure, subject to data availability and comparability.
Median Household Income Zip Code: Willow Springs (60480)
Median Household Income Zip Code: Willow Springs (60480)
$98,659
(2018-2022)
Compared to:
IL Zip Codes
The distribution is based on data from 1,338 Illinois zip codes.
U.S. Zip Codes
The distribution is based on data from 30,405 U.S. zip codes.
Cook, IL County Value
($78,304)
The regional value is compared to the Cook County value.
Trend
This comparison measures the indicator’s values over multiple time periods.<br>The Mann-Kendall Test for Statistical Significance is used to evaluate the trend<br>over 4 to 10 periods of measure, subject to data availability and comparability.
Economy / Income
Households that are Asset Limited, Income Constrained, Employed (ALICE)
Value
Compared to:
Households that are Asset Limited, Income Constrained, Employed (ALICE) Zip Code: Bridgeview (60455)
Households that are Asset Limited, Income Constrained, Employed (ALICE) Zip Code: Bridgeview (60455)
28.4%
(2021)
Compared to:

IL Zip Codes
The distribution is based on data from 1,248 Illinois zip codes.
Cook, IL County Value
(22.2%)
The regional value is compared to the Cook County value.
Prior Value
(27.8%)
Prior Value compares a measured value with the previously measured value. Confidence intervals were not taken into account in determining the direction of the comparison.
Households that are Asset Limited, Income Constrained, Employed (ALICE) Zip Code: Broadview (60155)
Households that are Asset Limited, Income Constrained, Employed (ALICE) Zip Code: Broadview (60155)
30.1%
(2021)
Compared to:
IL Zip Codes
The distribution is based on data from 1,248 Illinois zip codes.
Cook, IL County Value
(22.2%)
The regional value is compared to the Cook County value.
Prior Value
(32.0%)
Prior Value compares a measured value with the previously measured value. Confidence intervals were not taken into account in determining the direction of the comparison.
Households that are Asset Limited, Income Constrained, Employed (ALICE) Zip Code: Brookfield (60513)
Households that are Asset Limited, Income Constrained, Employed (ALICE) Zip Code: Brookfield (60513)
20.9%
(2021)
Compared to:
IL Zip Codes
The distribution is based on data from 1,248 Illinois zip codes.
Cook, IL County Value
(22.2%)
The regional value is compared to the Cook County value.
Prior Value
(17.5%)
Prior Value compares a measured value with the previously measured value. Confidence intervals were not taken into account in determining the direction of the comparison.
Households that are Asset Limited, Income Constrained, Employed (ALICE) Zip Code: Burr Ridge, Willowbrook (60527)
Households that are Asset Limited, Income Constrained, Employed (ALICE) Zip Code: Burr Ridge, Willowbrook (60527)
19.2%
(2021)
Compared to:
IL Zip Codes
The distribution is based on data from 1,248 Illinois zip codes.
DuPage, IL County Value
(20.9%)
The regional value is compared to the DuPage County value.
Prior Value
(24.1%)
Prior Value compares a measured value with the previously measured value. Confidence intervals were not taken into account in determining the direction of the comparison.
Households that are Asset Limited, Income Constrained, Employed (ALICE) Zip Code: Clarendon Hills (60514)
Households that are Asset Limited, Income Constrained, Employed (ALICE) Zip Code: Clarendon Hills (60514)
25.3%
(2021)
Compared to:
IL Zip Codes
The distribution is based on data from 1,248 Illinois zip codes.
DuPage, IL County Value
(20.9%)
The regional value is compared to the DuPage County value.
Prior Value
(19.6%)
Prior Value compares a measured value with the previously measured value. Confidence intervals were not taken into account in determining the direction of the comparison.
Households that are Asset Limited, Income Constrained, Employed (ALICE) Zip Code: Countryside, Hodgkins, Indian Head Park, La Grange, McCook (60525)
Households that are Asset Limited, Income Constrained, Employed (ALICE) Zip Code: Countryside, Hodgkins, Indian Head Park, La Grange, McCook (60525)
18.0%
(2021)
Compared to:
IL Zip Codes
The distribution is based on data from 1,248 Illinois zip codes.
Cook, IL County Value
(22.2%)
The regional value is compared to the Cook County value.
Prior Value
(20.2%)
Prior Value compares a measured value with the previously measured value. Confidence intervals were not taken into account in determining the direction of the comparison.
Households that are Asset Limited, Income Constrained, Employed (ALICE) Zip Code: Darien (60561)
Households that are Asset Limited, Income Constrained, Employed (ALICE) Zip Code: Darien (60561)
23.6%
(2021)
Compared to:
IL Zip Codes
The distribution is based on data from 1,248 Illinois zip codes.
DuPage, IL County Value
(20.9%)
The regional value is compared to the DuPage County value.
Prior Value
(23.5%)
Prior Value compares a measured value with the previously measured value. Confidence intervals were not taken into account in determining the direction of the comparison.
Households that are Asset Limited, Income Constrained, Employed (ALICE) Zip Code: Downers Grove (60515)
Households that are Asset Limited, Income Constrained, Employed (ALICE) Zip Code: Downers Grove (60515)
23.6%
(2021)
Compared to:
IL Zip Codes
The distribution is based on data from 1,248 Illinois zip codes.
DuPage, IL County Value
(20.9%)
The regional value is compared to the DuPage County value.
Prior Value
(25.6%)
Prior Value compares a measured value with the previously measured value. Confidence intervals were not taken into account in determining the direction of the comparison.
Households that are Asset Limited, Income Constrained, Employed (ALICE) Zip Code: Downers Grove (60516)
Households that are Asset Limited, Income Constrained, Employed (ALICE) Zip Code: Downers Grove (60516)
23.8%
(2021)
Compared to:
IL Zip Codes
The distribution is based on data from 1,248 Illinois zip codes.
DuPage, IL County Value
(20.9%)
The regional value is compared to the DuPage County value.
Prior Value
(23.2%)
Prior Value compares a measured value with the previously measured value. Confidence intervals were not taken into account in determining the direction of the comparison.
Households that are Asset Limited, Income Constrained, Employed (ALICE) Zip Code: Hickory Hills (60457)
Households that are Asset Limited, Income Constrained, Employed (ALICE) Zip Code: Hickory Hills (60457)
25.8%
(2021)
Compared to:
IL Zip Codes
The distribution is based on data from 1,248 Illinois zip codes.
Cook, IL County Value
(22.2%)
The regional value is compared to the Cook County value.
Prior Value
(25.1%)
Prior Value compares a measured value with the previously measured value. Confidence intervals were not taken into account in determining the direction of the comparison.
Households that are Asset Limited, Income Constrained, Employed (ALICE) Zip Code: Hinsdale (60521)
Households that are Asset Limited, Income Constrained, Employed (ALICE) Zip Code: Hinsdale (60521)
10.8%
(2021)
Compared to:
IL Zip Codes
The distribution is based on data from 1,248 Illinois zip codes.
DuPage, IL County Value
(20.9%)
The regional value is compared to the DuPage County value.
Prior Value
(13.2%)
Prior Value compares a measured value with the previously measured value. Confidence intervals were not taken into account in determining the direction of the comparison.
Households that are Asset Limited, Income Constrained, Employed (ALICE) Zip Code: Justice (60458)
Households that are Asset Limited, Income Constrained, Employed (ALICE) Zip Code: Justice (60458)
26.7%
(2021)
Compared to:
IL Zip Codes
The distribution is based on data from 1,248 Illinois zip codes.
Cook, IL County Value
(22.2%)
The regional value is compared to the Cook County value.
Prior Value
(28.0%)
Prior Value compares a measured value with the previously measured value. Confidence intervals were not taken into account in determining the direction of the comparison.
Households that are Asset Limited, Income Constrained, Employed (ALICE) Zip Code: La Grange Park (60526)
Households that are Asset Limited, Income Constrained, Employed (ALICE) Zip Code: La Grange Park (60526)
17.5%
(2021)
Compared to:
IL Zip Codes
The distribution is based on data from 1,248 Illinois zip codes.
Cook, IL County Value
(22.2%)
The regional value is compared to the Cook County value.
Prior Value
(17.0%)
Prior Value compares a measured value with the previously measured value. Confidence intervals were not taken into account in determining the direction of the comparison.
Households that are Asset Limited, Income Constrained, Employed (ALICE) Zip Code: Lyons (60534)
Households that are Asset Limited, Income Constrained, Employed (ALICE) Zip Code: Lyons (60534)
32.5%
(2021)
Compared to:
IL Zip Codes
The distribution is based on data from 1,248 Illinois zip codes.
Cook, IL County Value
(22.2%)
The regional value is compared to the Cook County value.
Prior Value
(27.7%)
Prior Value compares a measured value with the previously measured value. Confidence intervals were not taken into account in determining the direction of the comparison.
Households that are Asset Limited, Income Constrained, Employed (ALICE) Zip Code: North Riverside, Riverside (60546)
Households that are Asset Limited, Income Constrained, Employed (ALICE) Zip Code: North Riverside, Riverside (60546)
23.8%
(2021)
Compared to:
IL Zip Codes
The distribution is based on data from 1,248 Illinois zip codes.
Cook, IL County Value
(22.2%)
The regional value is compared to the Cook County value.
Prior Value
(18.8%)
Prior Value compares a measured value with the previously measured value. Confidence intervals were not taken into account in determining the direction of the comparison.
Households that are Asset Limited, Income Constrained, Employed (ALICE) Zip Code: Oak Brook (60523)
Households that are Asset Limited, Income Constrained, Employed (ALICE) Zip Code: Oak Brook (60523)
22.8%
(2021)
Compared to:
IL Zip Codes
The distribution is based on data from 1,248 Illinois zip codes.
DuPage, IL County Value
(20.9%)
The regional value is compared to the DuPage County value.
Prior Value
(22.7%)
Prior Value compares a measured value with the previously measured value. Confidence intervals were not taken into account in determining the direction of the comparison.
Households that are Asset Limited, Income Constrained, Employed (ALICE) Zip Code: Stickney (60402)
Households that are Asset Limited, Income Constrained, Employed (ALICE) Zip Code: Stickney (60402)
27.3%
(2021)
Compared to:
IL Zip Codes
The distribution is based on data from 1,248 Illinois zip codes.
Cook, IL County Value
(22.2%)
The regional value is compared to the Cook County value.
Prior Value
(25.5%)
Prior Value compares a measured value with the previously measured value. Confidence intervals were not taken into account in determining the direction of the comparison.
Households that are Asset Limited, Income Constrained, Employed (ALICE) Zip Code: Summit (60501)
Households that are Asset Limited, Income Constrained, Employed (ALICE) Zip Code: Summit (60501)
37.3%
(2021)
Compared to:
IL Zip Codes
The distribution is based on data from 1,248 Illinois zip codes.
Cook, IL County Value
(22.2%)
The regional value is compared to the Cook County value.
Prior Value
(29.2%)
Prior Value compares a measured value with the previously measured value. Confidence intervals were not taken into account in determining the direction of the comparison.
Households that are Asset Limited, Income Constrained, Employed (ALICE) Zip Code: Westchester (60154)
Households that are Asset Limited, Income Constrained, Employed (ALICE) Zip Code: Westchester (60154)
18.7%
(2021)
Compared to:
IL Zip Codes
The distribution is based on data from 1,248 Illinois zip codes.
Cook, IL County Value
(22.2%)
The regional value is compared to the Cook County value.
Prior Value
(18.3%)
Prior Value compares a measured value with the previously measured value. Confidence intervals were not taken into account in determining the direction of the comparison.
Households that are Asset Limited, Income Constrained, Employed (ALICE) Zip Code: Western Springs (60558)
Households that are Asset Limited, Income Constrained, Employed (ALICE) Zip Code: Western Springs (60558)
6.2%
(2021)
Compared to:
IL Zip Codes
The distribution is based on data from 1,248 Illinois zip codes.
Cook, IL County Value
(22.2%)
The regional value is compared to the Cook County value.
Prior Value
(7.8%)
Prior Value compares a measured value with the previously measured value. Confidence intervals were not taken into account in determining the direction of the comparison.
Households that are Asset Limited, Income Constrained, Employed (ALICE) Zip Code: Westmont (60559)
Households that are Asset Limited, Income Constrained, Employed (ALICE) Zip Code: Westmont (60559)
25.7%
(2021)
Compared to:
IL Zip Codes
The distribution is based on data from 1,248 Illinois zip codes.
DuPage, IL County Value
(20.9%)
The regional value is compared to the DuPage County value.
Prior Value
(31.5%)
Prior Value compares a measured value with the previously measured value. Confidence intervals were not taken into account in determining the direction of the comparison.
Households that are Asset Limited, Income Constrained, Employed (ALICE) Zip Code: Willow Springs (60480)
Households that are Asset Limited, Income Constrained, Employed (ALICE) Zip Code: Willow Springs (60480)
16.0%
(2021)
Compared to:
IL Zip Codes
The distribution is based on data from 1,248 Illinois zip codes.
Cook, IL County Value
(22.2%)
The regional value is compared to the Cook County value.
Prior Value
(18.1%)
Prior Value compares a measured value with the previously measured value. Confidence intervals were not taken into account in determining the direction of the comparison.
Economy / Poverty
People Living Below Poverty Level Zip Code: Bridgeview (60455)
People Living Below Poverty Level Zip Code: Bridgeview (60455)
16.6%
(2018-2022)
Compared to:
IL Zip Codes
The distribution is based on data from 1,385 Illinois zip codes.
U.S. Zip Codes
The distribution is based on data from 32,753 U.S. zip codes.
Cook, IL County Value
(13.4%)
The regional value is compared to the Cook County value.
Trend
This comparison measures the indicator’s values over multiple time periods.<br>The Mann-Kendall Test for Statistical Significance is used to evaluate the trend<br>over 4 to 10 periods of measure, subject to data availability and comparability.
People Living Below Poverty Level Zip Code: Broadview (60155)
People Living Below Poverty Level Zip Code: Broadview (60155)
13.6%
(2018-2022)
Compared to:
IL Zip Codes
The distribution is based on data from 1,385 Illinois zip codes.
U.S. Zip Codes
The distribution is based on data from 32,753 U.S. zip codes.
Cook, IL County Value
(13.4%)
The regional value is compared to the Cook County value.
Trend
This comparison measures the indicator’s values over multiple time periods.<br>The Mann-Kendall Test for Statistical Significance is used to evaluate the trend<br>over 4 to 10 periods of measure, subject to data availability and comparability.
People Living Below Poverty Level Zip Code: Brookfield (60513)
People Living Below Poverty Level Zip Code: Brookfield (60513)
5.1%
(2018-2022)
Compared to:
IL Zip Codes
The distribution is based on data from 1,385 Illinois zip codes.
U.S. Zip Codes
The distribution is based on data from 32,753 U.S. zip codes.
Cook, IL County Value
(13.4%)
The regional value is compared to the Cook County value.
Trend
This comparison measures the indicator’s values over multiple time periods.<br>The Mann-Kendall Test for Statistical Significance is used to evaluate the trend<br>over 4 to 10 periods of measure, subject to data availability and comparability.
People Living Below Poverty Level Zip Code: Burr Ridge, Willowbrook (60527)
People Living Below Poverty Level Zip Code: Burr Ridge, Willowbrook (60527)
9.6%
(2018-2022)
Compared to:
IL Zip Codes
The distribution is based on data from 1,385 Illinois zip codes.
U.S. Zip Codes
The distribution is based on data from 32,753 U.S. zip codes.
DuPage, IL County Value
(6.3%)
The regional value is compared to the DuPage County value.
Trend
This comparison measures the indicator’s values over multiple time periods.<br>The Mann-Kendall Test for Statistical Significance is used to evaluate the trend<br>over 4 to 10 periods of measure, subject to data availability and comparability.
People Living Below Poverty Level Zip Code: Clarendon Hills (60514)
People Living Below Poverty Level Zip Code: Clarendon Hills (60514)
8.1%
(2018-2022)
Compared to:
IL Zip Codes
The distribution is based on data from 1,385 Illinois zip codes.
U.S. Zip Codes
The distribution is based on data from 32,753 U.S. zip codes.
DuPage, IL County Value
(6.3%)
The regional value is compared to the DuPage County value.
Trend
This comparison measures the indicator’s values over multiple time periods.<br>The Mann-Kendall Test for Statistical Significance is used to evaluate the trend<br>over 4 to 10 periods of measure, subject to data availability and comparability.
People Living Below Poverty Level Zip Code: Countryside, Hodgkins, Indian Head Park, La Grange, McCook (60525)
People Living Below Poverty Level Zip Code: Countryside, Hodgkins, Indian Head Park, La Grange, McCook (60525)
5.4%
(2018-2022)
Compared to:
IL Zip Codes
The distribution is based on data from 1,385 Illinois zip codes.
U.S. Zip Codes
The distribution is based on data from 32,753 U.S. zip codes.
Cook, IL County Value
(13.4%)
The regional value is compared to the Cook County value.
Trend
This comparison measures the indicator’s values over multiple time periods.<br>The Mann-Kendall Test for Statistical Significance is used to evaluate the trend<br>over 4 to 10 periods of measure, subject to data availability and comparability.
People Living Below Poverty Level Zip Code: Darien (60561)
People Living Below Poverty Level Zip Code: Darien (60561)
3.2%
(2018-2022)
Compared to:
IL Zip Codes
The distribution is based on data from 1,385 Illinois zip codes.
U.S. Zip Codes
The distribution is based on data from 32,753 U.S. zip codes.
DuPage, IL County Value
(6.3%)
The regional value is compared to the DuPage County value.
Trend
This comparison measures the indicator’s values over multiple time periods.<br>The Mann-Kendall Test for Statistical Significance is used to evaluate the trend<br>over 4 to 10 periods of measure, subject to data availability and comparability.
People Living Below Poverty Level Zip Code: Downers Grove (60515)
People Living Below Poverty Level Zip Code: Downers Grove (60515)
5.0%
(2018-2022)
Compared to:
IL Zip Codes
The distribution is based on data from 1,385 Illinois zip codes.
U.S. Zip Codes
The distribution is based on data from 32,753 U.S. zip codes.
DuPage, IL County Value
(6.3%)
The regional value is compared to the DuPage County value.
Trend
This comparison measures the indicator’s values over multiple time periods.<br>The Mann-Kendall Test for Statistical Significance is used to evaluate the trend<br>over 4 to 10 periods of measure, subject to data availability and comparability.
People Living Below Poverty Level Zip Code: Downers Grove (60516)
People Living Below Poverty Level Zip Code: Downers Grove (60516)
4.9%
(2018-2022)
Compared to:
IL Zip Codes
The distribution is based on data from 1,385 Illinois zip codes.
U.S. Zip Codes
The distribution is based on data from 32,753 U.S. zip codes.
DuPage, IL County Value
(6.3%)
The regional value is compared to the DuPage County value.
Trend
This comparison measures the indicator’s values over multiple time periods.<br>The Mann-Kendall Test for Statistical Significance is used to evaluate the trend<br>over 4 to 10 periods of measure, subject to data availability and comparability.
People Living Below Poverty Level Zip Code: Hickory Hills (60457)
People Living Below Poverty Level Zip Code: Hickory Hills (60457)
7.4%
(2018-2022)
Compared to:
IL Zip Codes
The distribution is based on data from 1,385 Illinois zip codes.
U.S. Zip Codes
The distribution is based on data from 32,753 U.S. zip codes.
Cook, IL County Value
(13.4%)
The regional value is compared to the Cook County value.
Trend
This comparison measures the indicator’s values over multiple time periods.<br>The Mann-Kendall Test for Statistical Significance is used to evaluate the trend<br>over 4 to 10 periods of measure, subject to data availability and comparability.
People Living Below Poverty Level Zip Code: Hinsdale (60521)
People Living Below Poverty Level Zip Code: Hinsdale (60521)
1.5%
(2018-2022)
Compared to:
IL Zip Codes
The distribution is based on data from 1,385 Illinois zip codes.
U.S. Zip Codes
The distribution is based on data from 32,753 U.S. zip codes.
DuPage, IL County Value
(6.3%)
The regional value is compared to the DuPage County value.
Trend
This comparison measures the indicator’s values over multiple time periods.<br>The Mann-Kendall Test for Statistical Significance is used to evaluate the trend<br>over 4 to 10 periods of measure, subject to data availability and comparability.
People Living Below Poverty Level Zip Code: Justice (60458)
People Living Below Poverty Level Zip Code: Justice (60458)
23.9%
(2018-2022)
Compared to:
IL Zip Codes
The distribution is based on data from 1,385 Illinois zip codes.
U.S. Zip Codes
The distribution is based on data from 32,753 U.S. zip codes.
Cook, IL County Value
(13.4%)
The regional value is compared to the Cook County value.
Trend
This comparison measures the indicator’s values over multiple time periods.<br>The Mann-Kendall Test for Statistical Significance is used to evaluate the trend<br>over 4 to 10 periods of measure, subject to data availability and comparability.
People Living Below Poverty Level Zip Code: La Grange Park (60526)
People Living Below Poverty Level Zip Code: La Grange Park (60526)
3.8%
(2018-2022)
Compared to:
IL Zip Codes
The distribution is based on data from 1,385 Illinois zip codes.
U.S. Zip Codes
The distribution is based on data from 32,753 U.S. zip codes.
Cook, IL County Value
(13.4%)
The regional value is compared to the Cook County value.
Trend
This comparison measures the indicator’s values over multiple time periods.<br>The Mann-Kendall Test for Statistical Significance is used to evaluate the trend<br>over 4 to 10 periods of measure, subject to data availability and comparability.
People Living Below Poverty Level Zip Code: Lyons (60534)
People Living Below Poverty Level Zip Code: Lyons (60534)
7.4%
(2018-2022)
Compared to:
IL Zip Codes
The distribution is based on data from 1,385 Illinois zip codes.
U.S. Zip Codes
The distribution is based on data from 32,753 U.S. zip codes.
Cook, IL County Value
(13.4%)
The regional value is compared to the Cook County value.
Trend
This comparison measures the indicator’s values over multiple time periods.<br>The Mann-Kendall Test for Statistical Significance is used to evaluate the trend<br>over 4 to 10 periods of measure, subject to data availability and comparability.
People Living Below Poverty Level Zip Code: North Riverside, Riverside (60546)
People Living Below Poverty Level Zip Code: North Riverside, Riverside (60546)
3.8%
(2018-2022)
Compared to:
IL Zip Codes
The distribution is based on data from 1,385 Illinois zip codes.
U.S. Zip Codes
The distribution is based on data from 32,753 U.S. zip codes.
Cook, IL County Value
(13.4%)
The regional value is compared to the Cook County value.
Trend
This comparison measures the indicator’s values over multiple time periods.<br>The Mann-Kendall Test for Statistical Significance is used to evaluate the trend<br>over 4 to 10 periods of measure, subject to data availability and comparability.
People Living Below Poverty Level Zip Code: Oak Brook (60523)
People Living Below Poverty Level Zip Code: Oak Brook (60523)
9.3%
(2018-2022)
Compared to:
IL Zip Codes
The distribution is based on data from 1,385 Illinois zip codes.
U.S. Zip Codes
The distribution is based on data from 32,753 U.S. zip codes.
DuPage, IL County Value
(6.3%)
The regional value is compared to the DuPage County value.
Trend
This comparison measures the indicator’s values over multiple time periods.<br>The Mann-Kendall Test for Statistical Significance is used to evaluate the trend<br>over 4 to 10 periods of measure, subject to data availability and comparability.
People Living Below Poverty Level Zip Code: Stickney (60402)
People Living Below Poverty Level Zip Code: Stickney (60402)
11.0%
(2018-2022)
Compared to:
IL Zip Codes
The distribution is based on data from 1,385 Illinois zip codes.
U.S. Zip Codes
The distribution is based on data from 32,753 U.S. zip codes.
Cook, IL County Value
(13.4%)
The regional value is compared to the Cook County value.
Trend
This comparison measures the indicator’s values over multiple time periods.<br>The Mann-Kendall Test for Statistical Significance is used to evaluate the trend<br>over 4 to 10 periods of measure, subject to data availability and comparability.
People Living Below Poverty Level Zip Code: Summit (60501)
People Living Below Poverty Level Zip Code: Summit (60501)
13.1%
(2018-2022)
Compared to:
IL Zip Codes
The distribution is based on data from 1,385 Illinois zip codes.
U.S. Zip Codes
The distribution is based on data from 32,753 U.S. zip codes.
Cook, IL County Value
(13.4%)
The regional value is compared to the Cook County value.
Trend
This comparison measures the indicator’s values over multiple time periods.<br>The Mann-Kendall Test for Statistical Significance is used to evaluate the trend<br>over 4 to 10 periods of measure, subject to data availability and comparability.
People Living Below Poverty Level Zip Code: Westchester (60154)
People Living Below Poverty Level Zip Code: Westchester (60154)
3.4%
(2018-2022)
Compared to:
IL Zip Codes
The distribution is based on data from 1,385 Illinois zip codes.
U.S. Zip Codes
The distribution is based on data from 32,753 U.S. zip codes.
Cook, IL County Value
(13.4%)
The regional value is compared to the Cook County value.
Trend
This comparison measures the indicator’s values over multiple time periods.<br>The Mann-Kendall Test for Statistical Significance is used to evaluate the trend<br>over 4 to 10 periods of measure, subject to data availability and comparability.
People Living Below Poverty Level Zip Code: Western Springs (60558)
People Living Below Poverty Level Zip Code: Western Springs (60558)
2.6%
(2018-2022)
Compared to:
IL Zip Codes
The distribution is based on data from 1,385 Illinois zip codes.
U.S. Zip Codes
The distribution is based on data from 32,753 U.S. zip codes.
Cook, IL County Value
(13.4%)
The regional value is compared to the Cook County value.
Trend
This comparison measures the indicator’s values over multiple time periods.<br>The Mann-Kendall Test for Statistical Significance is used to evaluate the trend<br>over 4 to 10 periods of measure, subject to data availability and comparability.
People Living Below Poverty Level Zip Code: Westmont (60559)
People Living Below Poverty Level Zip Code: Westmont (60559)
10.0%
(2018-2022)
Compared to:
IL Zip Codes
The distribution is based on data from 1,385 Illinois zip codes.
U.S. Zip Codes
The distribution is based on data from 32,753 U.S. zip codes.
DuPage, IL County Value
(6.3%)
The regional value is compared to the DuPage County value.
Trend
This comparison measures the indicator’s values over multiple time periods.<br>The Mann-Kendall Test for Statistical Significance is used to evaluate the trend<br>over 4 to 10 periods of measure, subject to data availability and comparability.
People Living Below Poverty Level Zip Code: Willow Springs (60480)
People Living Below Poverty Level Zip Code: Willow Springs (60480)
4.4%
(2018-2022)
Compared to:
IL Zip Codes
The distribution is based on data from 1,385 Illinois zip codes.
U.S. Zip Codes
The distribution is based on data from 32,753 U.S. zip codes.
Cook, IL County Value
(13.4%)
The regional value is compared to the Cook County value.
Trend
This comparison measures the indicator’s values over multiple time periods.<br>The Mann-Kendall Test for Statistical Significance is used to evaluate the trend<br>over 4 to 10 periods of measure, subject to data availability and comparability.
Children Living Below Poverty Level Zip Code: Bridgeview (60455)
Children Living Below Poverty Level Zip Code: Bridgeview (60455)
26.3%
(2018-2022)
Compared to:
IL Zip Codes
The distribution is based on data from 1,360 Illinois zip codes.
U.S. Zip Codes
The distribution is based on data from 31,299 U.S. zip codes.
Cook, IL County Value
(18.3%)
The regional value is compared to the Cook County value.
Trend
This comparison measures the indicator’s values over multiple time periods.<br>The Mann-Kendall Test for Statistical Significance is used to evaluate the trend<br>over 4 to 10 periods of measure, subject to data availability and comparability.
Children Living Below Poverty Level Zip Code: Broadview (60155)
Children Living Below Poverty Level Zip Code: Broadview (60155)
21.3%
(2018-2022)
Compared to:
IL Zip Codes
The distribution is based on data from 1,360 Illinois zip codes.
U.S. Zip Codes
The distribution is based on data from 31,299 U.S. zip codes.
Cook, IL County Value
(18.3%)
The regional value is compared to the Cook County value.
Trend
This comparison measures the indicator’s values over multiple time periods.<br>The Mann-Kendall Test for Statistical Significance is used to evaluate the trend<br>over 4 to 10 periods of measure, subject to data availability and comparability.
Children Living Below Poverty Level Zip Code: Brookfield (60513)
Children Living Below Poverty Level Zip Code: Brookfield (60513)
3.9%
(2018-2022)
Compared to:
IL Zip Codes
The distribution is based on data from 1,360 Illinois zip codes.
U.S. Zip Codes
The distribution is based on data from 31,299 U.S. zip codes.
Cook, IL County Value
(18.3%)
The regional value is compared to the Cook County value.
Trend
This comparison measures the indicator’s values over multiple time periods.<br>The Mann-Kendall Test for Statistical Significance is used to evaluate the trend<br>over 4 to 10 periods of measure, subject to data availability and comparability.
Children Living Below Poverty Level Zip Code: Burr Ridge, Willowbrook (60527)
Children Living Below Poverty Level Zip Code: Burr Ridge, Willowbrook (60527)
16.8%
(2018-2022)
Compared to:
IL Zip Codes
The distribution is based on data from 1,360 Illinois zip codes.
U.S. Zip Codes
The distribution is based on data from 31,299 U.S. zip codes.
DuPage, IL County Value
(7.4%)
The regional value is compared to the DuPage County value.
Trend
This comparison measures the indicator’s values over multiple time periods.<br>The Mann-Kendall Test for Statistical Significance is used to evaluate the trend<br>over 4 to 10 periods of measure, subject to data availability and comparability.
Children Living Below Poverty Level Zip Code: Clarendon Hills (60514)
Children Living Below Poverty Level Zip Code: Clarendon Hills (60514)
6.5%
(2018-2022)
Compared to:
IL Zip Codes
The distribution is based on data from 1,360 Illinois zip codes.
U.S. Zip Codes
The distribution is based on data from 31,299 U.S. zip codes.
DuPage, IL County Value
(7.4%)
The regional value is compared to the DuPage County value.
Trend
This comparison measures the indicator’s values over multiple time periods.<br>The Mann-Kendall Test for Statistical Significance is used to evaluate the trend<br>over 4 to 10 periods of measure, subject to data availability and comparability.
Children Living Below Poverty Level Zip Code: Countryside, Hodgkins, Indian Head Park, La Grange, McCook (60525)
Children Living Below Poverty Level Zip Code: Countryside, Hodgkins, Indian Head Park, La Grange, McCook (60525)
6.2%
(2018-2022)
Compared to:
IL Zip Codes
The distribution is based on data from 1,360 Illinois zip codes.
U.S. Zip Codes
The distribution is based on data from 31,299 U.S. zip codes.
Cook, IL County Value
(18.3%)
The regional value is compared to the Cook County value.
Trend
This comparison measures the indicator’s values over multiple time periods.<br>The Mann-Kendall Test for Statistical Significance is used to evaluate the trend<br>over 4 to 10 periods of measure, subject to data availability and comparability.
Children Living Below Poverty Level Zip Code: Darien (60561)
Children Living Below Poverty Level Zip Code: Darien (60561)
4.7%
(2018-2022)
Compared to:
IL Zip Codes
The distribution is based on data from 1,360 Illinois zip codes.
U.S. Zip Codes
The distribution is based on data from 31,299 U.S. zip codes.
DuPage, IL County Value
(7.4%)
The regional value is compared to the DuPage County value.
Trend
This comparison measures the indicator’s values over multiple time periods.<br>The Mann-Kendall Test for Statistical Significance is used to evaluate the trend<br>over 4 to 10 periods of measure, subject to data availability and comparability.
Children Living Below Poverty Level Zip Code: Downers Grove (60515)
Children Living Below Poverty Level Zip Code: Downers Grove (60515)
1.0%
(2018-2022)
Compared to:
IL Zip Codes
The distribution is based on data from 1,360 Illinois zip codes.
U.S. Zip Codes
The distribution is based on data from 31,299 U.S. zip codes.
DuPage, IL County Value
(7.4%)
The regional value is compared to the DuPage County value.
Trend
This comparison measures the indicator’s values over multiple time periods.<br>The Mann-Kendall Test for Statistical Significance is used to evaluate the trend<br>over 4 to 10 periods of measure, subject to data availability and comparability.
Children Living Below Poverty Level Zip Code: Downers Grove (60516)
Children Living Below Poverty Level Zip Code: Downers Grove (60516)
3.4%
(2018-2022)
Compared to:
IL Zip Codes
The distribution is based on data from 1,360 Illinois zip codes.
U.S. Zip Codes
The distribution is based on data from 31,299 U.S. zip codes.
DuPage, IL County Value
(7.4%)
The regional value is compared to the DuPage County value.
Trend
This comparison measures the indicator’s values over multiple time periods.<br>The Mann-Kendall Test for Statistical Significance is used to evaluate the trend<br>over 4 to 10 periods of measure, subject to data availability and comparability.
Children Living Below Poverty Level Zip Code: Hickory Hills (60457)
Children Living Below Poverty Level Zip Code: Hickory Hills (60457)
10.3%
(2018-2022)
Compared to:
IL Zip Codes
The distribution is based on data from 1,360 Illinois zip codes.
U.S. Zip Codes
The distribution is based on data from 31,299 U.S. zip codes.
Cook, IL County Value
(18.3%)
The regional value is compared to the Cook County value.
Trend
This comparison measures the indicator’s values over multiple time periods.<br>The Mann-Kendall Test for Statistical Significance is used to evaluate the trend<br>over 4 to 10 periods of measure, subject to data availability and comparability.
Children Living Below Poverty Level Zip Code: Hinsdale (60521)
Children Living Below Poverty Level Zip Code: Hinsdale (60521)
0.6%
(2018-2022)
Compared to:
IL Zip Codes
The distribution is based on data from 1,360 Illinois zip codes.
U.S. Zip Codes
The distribution is based on data from 31,299 U.S. zip codes.
DuPage, IL County Value
(7.4%)
The regional value is compared to the DuPage County value.
Trend
This comparison measures the indicator’s values over multiple time periods.<br>The Mann-Kendall Test for Statistical Significance is used to evaluate the trend<br>over 4 to 10 periods of measure, subject to data availability and comparability.
Children Living Below Poverty Level Zip Code: Justice (60458)
Children Living Below Poverty Level Zip Code: Justice (60458)
39.4%
(2018-2022)
Compared to:
IL Zip Codes
The distribution is based on data from 1,360 Illinois zip codes.
U.S. Zip Codes
The distribution is based on data from 31,299 U.S. zip codes.
Cook, IL County Value
(18.3%)
The regional value is compared to the Cook County value.
Trend
This comparison measures the indicator’s values over multiple time periods.<br>The Mann-Kendall Test for Statistical Significance is used to evaluate the trend<br>over 4 to 10 periods of measure, subject to data availability and comparability.
Children Living Below Poverty Level Zip Code: La Grange Park (60526)
Children Living Below Poverty Level Zip Code: La Grange Park (60526)
2.0%
(2018-2022)
Compared to:
IL Zip Codes
The distribution is based on data from 1,360 Illinois zip codes.
U.S. Zip Codes
The distribution is based on data from 31,299 U.S. zip codes.
Cook, IL County Value
(18.3%)
The regional value is compared to the Cook County value.
Trend
This comparison measures the indicator’s values over multiple time periods.<br>The Mann-Kendall Test for Statistical Significance is used to evaluate the trend<br>over 4 to 10 periods of measure, subject to data availability and comparability.
Children Living Below Poverty Level Zip Code: Lyons (60534)
Children Living Below Poverty Level Zip Code: Lyons (60534)
7.1%
(2018-2022)
Compared to:
IL Zip Codes
The distribution is based on data from 1,360 Illinois zip codes.
U.S. Zip Codes
The distribution is based on data from 31,299 U.S. zip codes.
Cook, IL County Value
(18.3%)
The regional value is compared to the Cook County value.
Trend
This comparison measures the indicator’s values over multiple time periods.<br>The Mann-Kendall Test for Statistical Significance is used to evaluate the trend<br>over 4 to 10 periods of measure, subject to data availability and comparability.
Children Living Below Poverty Level Zip Code: North Riverside, Riverside (60546)
Children Living Below Poverty Level Zip Code: North Riverside, Riverside (60546)
3.0%
(2018-2022)
Compared to:
IL Zip Codes
The distribution is based on data from 1,360 Illinois zip codes.
U.S. Zip Codes
The distribution is based on data from 31,299 U.S. zip codes.
Cook, IL County Value
(18.3%)
The regional value is compared to the Cook County value.
Trend
This comparison measures the indicator’s values over multiple time periods.<br>The Mann-Kendall Test for Statistical Significance is used to evaluate the trend<br>over 4 to 10 periods of measure, subject to data availability and comparability.
Children Living Below Poverty Level Zip Code: Oak Brook (60523)
Children Living Below Poverty Level Zip Code: Oak Brook (60523)
10.2%
(2018-2022)
Compared to:
IL Zip Codes
The distribution is based on data from 1,360 Illinois zip codes.
U.S. Zip Codes
The distribution is based on data from 31,299 U.S. zip codes.
DuPage, IL County Value
(7.4%)
The regional value is compared to the DuPage County value.
Trend
This comparison measures the indicator’s values over multiple time periods.<br>The Mann-Kendall Test for Statistical Significance is used to evaluate the trend<br>over 4 to 10 periods of measure, subject to data availability and comparability.
Children Living Below Poverty Level Zip Code: Stickney (60402)
Children Living Below Poverty Level Zip Code: Stickney (60402)
15.5%
(2018-2022)
Compared to:
IL Zip Codes
The distribution is based on data from 1,360 Illinois zip codes.
U.S. Zip Codes
The distribution is based on data from 31,299 U.S. zip codes.
Cook, IL County Value
(18.3%)
The regional value is compared to the Cook County value.
Trend
This comparison measures the indicator’s values over multiple time periods.<br>The Mann-Kendall Test for Statistical Significance is used to evaluate the trend<br>over 4 to 10 periods of measure, subject to data availability and comparability.
Children Living Below Poverty Level Zip Code: Summit (60501)
Children Living Below Poverty Level Zip Code: Summit (60501)
16.5%
(2018-2022)
Compared to:
IL Zip Codes
The distribution is based on data from 1,360 Illinois zip codes.
U.S. Zip Codes
The distribution is based on data from 31,299 U.S. zip codes.
Cook, IL County Value
(18.3%)
The regional value is compared to the Cook County value.
Trend
This comparison measures the indicator’s values over multiple time periods.<br>The Mann-Kendall Test for Statistical Significance is used to evaluate the trend<br>over 4 to 10 periods of measure, subject to data availability and comparability.
