Search for Indicators
Social Determinants of Health
The Centers for Disease Control defines social determinants of health (SDoH) as conditions in the places where people live, learn, work and play that affect health and well-being. This dashboard includes SDoH indicators including health care access, education, income, housing, transportation and public safety. Select a location using the drop-down list below. Click on an indicator to navigate to the Indicator Detail page where you can read more about the indicator.
Indicator Gauge Icon Legend
Legend Colors
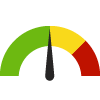
Red is bad, green is good, blue is not statistically different/neutral.
Compared to Distribution
 the value is in the best half of communities.
 the value is in the 2nd worst quarter of communities.
 the value is in the worst quarter of communities.
Compared to Target
 meets target;
  does not meet target.
Compared to a Single Value
 lower than the comparison value;
 higher than the comparison value;
 not statistically different from comparison value.
Trend

 non-significant change over time;
 significant change over time;
  no change over time.
Compared to Prior Value
 higher than the previous measurement period;
 lower than the previous measurement period;
 no statistically different change from previous measurement period.
Zip Code: Bridgeview (60455)
Value
Compared to:
Zip Code: Bridgeview (60455) Community Spending on Housing
Zip Code: Bridgeview (60455) Community Spending on Housing
32.6%
(2024)
Compared to:

Cook, IL County Value
(33.2%)
The regional value is compared to the Cook County value.
Prior Value
(32.6%)
Prior Value compares a measured value with the previously measured value. Confidence intervals were not taken into account in determining the direction of the comparison.
Zip Code: Bridgeview (60455) Community Spending on Food
Zip Code: Bridgeview (60455) Community Spending on Food
13.4%
(2024)
Compared to:

Cook, IL County Value
(12.0%)
The regional value is compared to the Cook County value.
Prior Value
(13.4%)
Prior Value compares a measured value with the previously measured value. Confidence intervals were not taken into account in determining the direction of the comparison.
Zip Code: Bridgeview (60455) Community Spending on Health Care
Zip Code: Bridgeview (60455) Community Spending on Health Care
8.9%
(2024)
Compared to:
Cook, IL County Value
(7.4%)
The regional value is compared to the Cook County value.
Prior Value
(8.9%)
Prior Value compares a measured value with the previously measured value. Confidence intervals were not taken into account in determining the direction of the comparison.
Zip Code: Bridgeview (60455) Medicaid Enrollment
Zip Code: Bridgeview (60455) Medicaid Enrollment
8,598
Number of persons
(2023)
Compared to:


Prior Value
(7,896)
Prior Value compares a measured value with the previously measured value. Confidence intervals were not taken into account in determining the direction of the comparison.
Trend
This comparison measures the indicator’s values over multiple time periods.<br>The Mann-Kendall Test for Statistical Significance is used to evaluate the trend<br>over 4 to 10 periods of measure, subject to data availability and comparability.
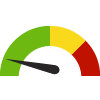
Zip Code: Bridgeview (60455) Households Living Below Poverty Level
Zip Code: Bridgeview (60455) Households Living Below Poverty Level
16.4%
(2022)
Compared to:


IL Zip Codes
The distribution is based on data from 1,260 Illinois zip codes.
Cook, IL County Value
(14.0% in 2021)
The regional value is compared to the Cook County value.
Prior Value
(15.6%)
Prior Value compares a measured value with the previously measured value. Confidence intervals were not taken into account in determining the direction of the comparison.
Zip Code: Bridgeview (60455) Households Receiving SNAP with Children
Zip Code: Bridgeview (60455) Households Receiving SNAP with Children
51.8%
(2018-2022)
Compared to:

Cook, IL County Value
(43.0%)
The regional value is compared to the Cook County value.
Trend
This comparison measures the indicator’s values over multiple time periods.<br>The Mann-Kendall Test for Statistical Significance is used to evaluate the trend<br>over 4 to 10 periods of measure, subject to data availability and comparability.
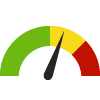
Zip Code: Bridgeview (60455) Adults with Disability Living in Poverty
Zip Code: Bridgeview (60455) Adults with Disability Living in Poverty
19.6%
(2018-2022)
Compared to:
IL Zip Codes
The distribution is based on data from 1,348 Illinois zip codes.
U.S. Zip Codes
The distribution is based on data from 30,884 U.S. zip codes.
Cook, IL County Value
(27.3%)
The regional value is compared to the Cook County value.
Trend
This comparison measures the indicator’s values over multiple time periods.<br>The Mann-Kendall Test for Statistical Significance is used to evaluate the trend<br>over 4 to 10 periods of measure, subject to data availability and comparability.
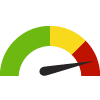
Zip Code: Bridgeview (60455) Households that are Asset Limited, Income Constrained, Employed (ALICE)
Zip Code: Bridgeview (60455) Households that are Asset Limited, Income Constrained, Employed (ALICE)
27.8%
(2022)
Compared to:
IL Zip Codes
The distribution is based on data from 1,260 Illinois zip codes.
Cook, IL County Value
(22.2% in 2021)
The regional value is compared to the Cook County value.
Prior Value
(28.4%)
Prior Value compares a measured value with the previously measured value. Confidence intervals were not taken into account in determining the direction of the comparison.
